Tachyon, Python 3.15's Built-in Sampling Profiler

Panelists


Episode Deep Dive
Guests Introduction and Background
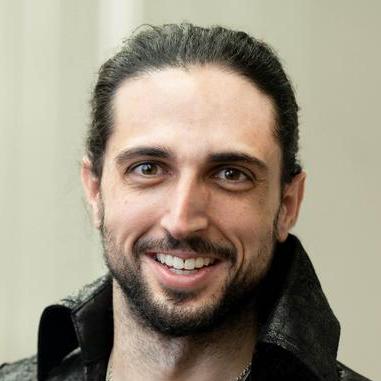
Pablo Galindo Salgado is a CPython core developer, a long-serving member of the Python Steering Council (about six years, "I think I'm furniture at this point"), and the release manager for Python 3.10 and 3.11, versions he still ships security releases for. He is the author of a lot of what lands in Python 3.15, including explicit lazy imports and the new sampling profiler. Pablo has been on Talk Python before for the Python 3.11 release, Memray, and PyStack, and he co-hosts the core.py podcast with Łukasz Langa. He is a physicist by training, which shows up in this episode more than once. After several years on the Python team at Bloomberg, where the profiler work started, he moved to Hudson River Trading, where he works on performance for large scale numeric and trading workloads.
László Kiss Kollár is a Python engineer at Bloomberg, where he has worked on the Python infrastructure team since 2018. He worked alongside Pablo for years there, contributed internally to projects like PyStack and Memray, and became Pablo's main collaborator on Tachyon starting at the PyCon US 2025 sprints. He built much of the CLI and reporting machinery around the profiler, and he co-authored the PEP that reorganizes Python's profiling tools. This is his first time on the show.
- talkpython.fm/episodes/show/388
- talkpython.fm/episodes/show/425
- talkpython.fm/episodes/show/419
- github.com/bloomberg
- hudsonrivertrading.com
What to Know If You're New to Python
This episode is about measuring where a Python program spends its time, and it gets into how the interpreter works under the hood. You do not need to have written C or read CPython's source, but a few mental models will make the conversation click.
- Profiler: A tool that tells you which parts of your program are slow, so you fix the real problem instead of the one you guessed. Python has shipped
profileandcProfilefor decades, and this episode is about a third, very different kind of profiler joining them in Python 3.15. See docs.python.org/3/library/profile.html. - Call stack and stack trace: When function A calls B which calls C, the interpreter keeps a stack of "frames" recording where it is. A stack trace is a snapshot of that stack, the same thing you see printed when an exception is raised. Tachyon works by reading that stack over and over, thousands of times per second.
- The GIL (Global Interpreter Lock): The lock in CPython that lets only one thread run Python bytecode at a time. It comes up because one of Tachyon's modes filters samples by who holds the GIL, and because the free-threaded build of Python removes it. See docs.python.org/3/glossary.html#term-global-interpreter-lock.
- asyncio and the event loop: Python's
asyncandawaitrun many tasks cooperatively on a single thread managed by an event loop. That makes ordinary profilers confusing, which is why Tachyon has a dedicated async-aware mode. See docs.python.org/3/library/asyncio.html. - C extensions: Libraries like NumPy, pandas, and Polars do their heavy lifting in compiled C or Rust code, not Python. A Python profiler can see who called into that code but not what happens inside it, which is the gap Pablo's follow-up project Cronon is meant to fill. See numpy.org.
Key Points and Takeaways
Python 3.15 ships Tachyon, a built-in sampling profiler
The headline of the episode is that Python 3.15, due in October 2026, includes a full sampling profiler in the standard library, importable as profiling.sampling and known to everyone who built it as Tachyon. Unlike the tracing profilers Python has always had, Tachyon runs as a separate process and reads the target program's stack from outside, so the profiled application does not know it is being watched and runs at full speed. It can attach to an already running process by PID, launch a script or module under the profiler, or dump a one-shot stack trace of a hung program. Pablo describes it as "a full beast" that does far more than being fast: flame graphs, a live top-style view, line heat maps, differential flame graphs, async-aware sampling, and multiple filtering modes. It works the same way on macOS, Windows, and Linux with the same guarantees. Pablo's advice to listeners is blunt: grab it, attach it to your application, and fix what it shows you. The official module name is profiling.sampling, but as Pablo puts it, that is the name for meetings with suits; among friends, call it Tachyon.
- docs.python.org/3.15/library/profiling.sampling.html
- docs.python.org/3.15/whatsnew/3.15.html
- github.com/python/cpython
Tracing profilers versus sampling profilers, and why the old ones slow you down
Pablo walked through the history of Python's built-in tools. The original profile module was written in Python and runs inside the program it measures, so it skews the results and can make an application around 20 times slower. cProfile is a reimplementation in C, roughly 10 times faster than profile, but it still runs in-process and still costs a 2x to 3x slowdown, which turns a five minute job into fifteen. Both are tracing profilers: they intercept every single function call and record it, which is why the overhead is inherent rather than a bug. The upside is exactness; if it says a function was called seven times, it was called seven times, and that matters for tools like Memray, where losing a one gigabyte allocation would be unacceptable. A sampling profiler instead peeks at the stack at a fixed frequency and builds a statistical picture, trading exact counts for near-zero impact. Michael added a practical warning that tracing profilers distort unevenly: code that makes millions of tiny Python calls looks far slower than code that makes one slow network call, even if both take the same real time. Pablo was clear that cProfile still has its uses and should not be thrown away.
PEP 799 reorganizes profiling into one package
László explained that the original plan was to drop the sampling profiler into the existing profile package, and it turned out that could not work, which led to a cleanup. PEP 799 creates a new profiling package with two clearly named halves: profiling.tracing, which is cProfile under a new home, and profiling.sampling, which is Tachyon. The cProfile import continues to work for compatibility, but the old pure-Python profile module is deprecated in 3.15 and 3.16 and will be removed in 3.17. The goal is ergonomics; László found the old documentation confusing when he first read it and could never tell why you would pick one tracing profiler over the other. Now the name tells you what you are getting. Pablo joked that profiling.sampling is a lot to type when it is the one you want almost every time, and he may try to get a top-level tachyon command added in 3.16, the way pip ships alongside Python.
PEP 768's remote debugging interface made it possible: "call it in a loop"
The machinery under Tachyon is PEP 768, the safe external debugger interface that shipped in Python 3.14. Pablo built that with colleagues at Bloomberg with a north star of letting pdb, or any debugger, attach to a running production process instead of restarting it under a debugger. To make that work, CPython gained the ability for an external process to safely inspect a running interpreter's state. At the PyCon US 2025 sprints Pablo walked over to László and asked, "would it be cool to call this in a loop?" Read the stack, record it, repeat, and you have a sampling profiler. Michael summarized it well: a debugger asks "what are you doing?" once, and a profiler asks "where are you, where are you, where are you?" a million times a second. That is why Tachyon is only possible in 3.14 and later, and why the full version needs 3.15's interpreter changes.
From two samples per second to over a million
The first version of that loop ran at two samples per second, which Pablo called "not fantastic" given that around 100 Hz is the minimum for a profiler to be useful at all. The plan for the sprint had been for Pablo to make the core fast while László built the CLI, but the moment they saw two hertz they both spent the rest of the sprint on performance and ended it with no code committed. Every change produced another 10x at first, and by the end of the sprints they were at 100,000 to 200,000 samples per second. Pablo later found another 4x to 5x, putting Tachyon above a million samples per second, and László remembers the headline later being that it is the fastest sampling profiler for Python. Pablo was candid that this is not because they are smarter than the authors of other profilers; because the profiler lives in CPython, they could change the interpreter itself purely to make sampling faster, and any other profiler is free to use the same tricks now that they exist. He also predicted the "fastest" title will not last long, which turned out to be a hint about Cronon.
Why put a profiler in the standard library when py-spy and Austin exist
Pablo was generous about py-spy, calling it a very good piece of software written in Rust, and he named Austin as well. The problem is structural: those tools have to reverse engineer interpreter internals that are not public, and the core team historically did not treat that as an API, so every release could break them. He gave the example that profiling 3.11 with external tools was much slower than profiling 3.10 because of internal changes, and sometimes changes made profiling outright impossible. Having a profiler inside CPython turns this into a promise: the feature will never break, and Tachyon doubles as a reference implementation that others can read and copy. The second reason is quality control; because the profiler touches delicate internals, the core team wants the batteries-included tool to handle every edge case they know about. László added a third benefit from the trenches: when you are working on a CPython alpha, no third-party profiler supports it yet, and he hit that exact problem trying to profile Tachyon's own Python code while building it.
Near-zero overhead makes profiling in production realistic
Michael asked whether attaching in production hurts performance, and Pablo's answer was that by default it is free. Tachyon never stops the application; it only reads memory from the outside, and unless you are on a single-core container sharing CPU with the profiler, the application never notices. The trade-off is that a read can catch a data structure mid-change, which happens more often with generators; Tachyon detects most of these partial reads and discards the sample. If you want every sample to be consistent, the --blocking flag pauses the target for a split millisecond per read, and at the default rate or even 10,000 Hz that costs about 1% to 2%. Push to 100,000 samples per second and you are looking at 20% to 80%, and at a million it is around 2x, but as Pablo said, you need to go really crazy to get there. His guidance for production is to sample at 100 to 1,000 Hz, attach for a bunch of seconds, detach, and go reason about the data. László framed the deeper point: the worst moments are exactly when you do not have profiling tools ready, and now all you need is Python 3.15 installed.
"You cannot measure the fake deal": a production story from HRT
Pablo said this style of profiling is used constantly at his employer and described what happened the very day of the recording. Hudson River Trading runs huge machines for its data scientists, hundreds of cores and hundreds of gigabytes of memory, and they had just enabled a version of this profiling across every program on one of those machines. The live data showed one application consuming an entire core when it should have been idle. Digging in, an algorithm turned out to be accidentally quadratic in a specific case that nobody expected to happen often; Pablo said no person on the planet would have spotted it reading the code, but it was "clear as day" in the profile. They removed it and freed a core on every machine in the supercomputer. His broader lesson is that you never know how an application behaves or what is slow until you measure real traffic, which is why attach-to-a-running-process matters more than launching under a profiler. Michael added a practical benefit of attaching: you skip the startup noise of imports and see only the steady-state work you care about.
Not just production: run, attach, and dump
László pushed back on the idea that Tachyon is only for emergencies. Beyond attaching to a live process, it has a run mode where you start a script or module under the profiler and it samples from the first line, which fits development workflows like profiling a test suite or a slow CLI tool. Reporters designed for development let you take two profiling snapshots, before and after a code change, and compare how much faster or slower things got. Pablo also highlighted dump mode: if an application is frozen in a deadlock or waiting on I/O that never arrives, profiling.sampling dump with the PID prints the current stack trace, like the traceback you would get from an exception but without anything being raised. He also noted that you could build continuous profiling on top of it by running at a low sampling frequency over long periods. All of this works identically on macOS, Windows, and Linux.
Output formats: from a plain list of slow functions to Gecko timelines
Pablo stressed that Tachyon tries to serve a very wide range of developers. If you just want an answer, it prints the handful of functions that are slowest, and you never need to read a flame graph. If you are more advanced, you can ask for flame graphs, line-level heat maps that color source lines by how hot or cold they are, and differential flame graphs that compare two runs to show which functions got faster and which got slower. A live mode shows the running functions of your application updating like top. Experts can go further with an opcode-level view of individual bytecode instructions. There is also a Gecko output format with an unadvertised "all" mode that records every sample and tags each one with what was happening, producing per-thread lanes on a timeline where you can watch the GIL bounce between threads, see that one ran for 20 milliseconds and another for 10, and estimate maximum throughput. Michael's summary of the documentation was simply that it is huge because the tool does so much.
Async-aware profiling sees the tasks, not just the event loop
Pablo said Tachyon is the first profiler that can properly handle asyncio, and he explained why regular sampling fails there. Imagine downloading a three gigabyte file from a slow server: your program is slow because it is waiting, but the event loop only wakes when data arrives, so a conventional profile never shows the waiting at all. Tracing is even worse because the loop hops from task to task and the trace becomes unreadable. Tachyon offers two async views. One shows only the tasks that are currently running, which tells you what work happens while you wait. The other shows every task that exists at each sample, including the ones blocked on I/O, so the task waiting on that download appears in sample after sample and you finally see where the time goes. Michael noted this matters most for a sampling profiler, since it cannot see the transition into and out of a wait.
Wall, CPU, GIL, and exception modes are filters over the samples
Michael asked about the profiling modes, and Pablo framed them all as filters. Wall-clock mode, the default, counts everything: if your program sleeps for five seconds, the profiler correctly reports five seconds in sleep, which is true but often not actionable. CPU mode drops the samples where the program is waiting on sleep, disk, or network and keeps only the ones where it is actually computing, which are the ones you can improve with a better algorithm or a faster JSON parser. GIL mode keeps only samples taken while the GIL is held, which answers a subtler question: in a multithreaded program, which code is preventing every other thread from running? Pablo's example was a function that spends ten seconds in NumPy but only holds the GIL for one of them. Exception mode measures how much time goes to raising and handling exceptions, which sounds negligible until you remember the iterator protocol uses StopIteration for control flow, and Michael's example of a tight loop doing try/except around int parsing of CSV fields. Pablo noted that GIL mode does not apply to the free-threaded build, where different tools are needed.
- docs.python.org/3/glossary.html#term-global-interpreter-lock
- docs.python.org/3.15/library/profiling.sampling.html
Same version only, and the community backport to 3.14
Because Tachyon relies on interpreter changes added in 3.15, it can currently only profile 3.15 processes from 3.15, whereas py-spy can attach to 3.12, 3.13, or 3.14 with varying performance. Pablo said backward compatibility is not ruled out; 3.16 might one day profile 3.15 and 3.16, but the team has not decided whether to take that on. Michael pulled up the pythonbackport/python-profiling project, which packages the profiler for 3.14, and Pablo read the repo live: it vendors the _remotedebugging code from CPython, strips the 3.15-only tricks, and its setup.py pins it to 3.14 only, which makes sense since it still needs the PEP 768 debugging interface. Pablo was happy to see people pulling tricks to use the tool everywhere, though he joked that 3.14 bug reports would get a "what are you doing?" László had tried the same thing himself and found the patch enormous; the idea of officially maintaining a separate backport package was rejected because every CPython patch release would mean more maintenance. Michael's take is that the backport is useful in the first year, not as a long-term path.
Cronon: Tachyon's brother that sees C and kernel code, going open source soon
Pablo closed with what he called a slightly selfish addition. Tachyon's one real limit is that it is a Python profiler: if your time is spent inside NumPy, pandas, Polars, or CUDA, it can tell you which Python function made the call but nothing about what happens inside. A C profiler has the mirror problem; it sees CPython's internals but reports _PyEval_EvalFrameDefault instead of your function names. Combining both is, in his words, ten times harder than Python profiling alone and a million times harder together, so the core team deliberately kept that complexity out of the standard library. Instead Pablo has spent much of the past year at HRT building Cronon, named for the hypothetical quantum of time. It has been in use across the company for nine months, profiles Python 3.12 through 3.15, sees Python, C, and kernel code in one stack (down to a NumPy array allocation triggering a page fault), streams results so a Grafana dashboard can show a flame graph changing live 24/7 without attaching, and runs on macOS and Linux. He said it will be open sourced in a month or two.
Explicit lazy imports and the hidden costs of importing everything
Before profiling, the conversation touched on Pablo's other big 3.15 feature. With explicit lazy imports you write lazy import module and the module is only loaded when it is first used. Pablo's motivation is that Python's packaging strength has a cost: importing one tiny function often pulls in an entire package, which pulls in its dependencies, until you are paying for the whole world, and some of those imports (Torch and the NVIDIA wheels, for instance) are very slow and very large. Michael shared that while cutting memory on the Talk Python courses site, he found roughly 100 megabytes of RAM going to rarely used imports like NumPy and Matplotlib for admin reports, and moving imports inside functions, which Pablo called "lazy imports at home," saved that memory outright. László pointed to CLI tools, where just showing the help page can take seconds because of eager imports. Pablo added a second-order effect people miss: every unused class, function, and constant is a live Python object the garbage collector has to walk, so every GC run gets slower, and unlike web apps with a fork model you cannot always use the Instagram-style gc.freeze() trick in scientific workloads. An implicit version was considered and rejected.
Faster CPython, the JIT, free threading, and why profiling matters more now
Michael asked where the Faster CPython effort landed after the organizational turbulence. Pablo called it a clear success if you compare 3.9 or 3.10 with today's Python, but said the team has run out of obvious things to optimize, and obvious never meant easy. The remaining big wins are large pieces of software like the JIT that take PEPs and years, and they interact awkwardly with free threading. László recalled the excitement of a release with a 30% to 40% free speedup, which made convincing teams to upgrade much easier and opened new areas where Python is competitive, and he has faith in the JIT while noting free threading may deliver bigger wins for certain workloads sooner. Michael worries that many library authors have never really thought about race conditions because the GIL sheltered them, and the first wave of fixes may bring deadlocks. Pablo's analogy was that Python developers have been crossing the desert in an air-conditioned car; free threading is the bicycle, and it also does not scale linearly because the checks that keep things from crashing cost something. All of which, he said, is why profiling is more important than ever: it is how you know whether your app got faster because of 3.15 or because NumPy did.
- github.com/faster-cpython
- peps.python.org/pep-0744
- peps.python.org/pep-0703
- docs.python.org/3/howto/free-threading-python.html
Why Python ships yearly and not faster
László admitted it feels strange to have built Tachyon in April and May of 2025 and still be waiting for the release; Pablo reminded him that until recently Python releases were two years apart. Michael asked whether releases should be every six or three months. Pablo said he would do rolling releases if he could, but CPython is too big and too depended upon; even a one-year cadence is at the edge of what the core team can responsibly stabilize. His evidence was that a new garbage collector implementation had to be reverted in 3.13 and again in 3.14 because its memory impact only became visible once real users ran it. Michael noted Python upgrades are unusually safe; only once has a major release broken one of his apps, when a database library deep in his stack still used the removed @asyncio.coroutine decorator. Pablo countered that at Bloomberg-sized or HRT-sized codebases you hit those all the time, often indirectly, because a new Python forces a new NumPy or pandas and suddenly the floating point results of a simulation are slightly different. The good news is the core team now works with NumPy and pandas to have wheels ready on release day, which was not true in the 3.8 era.
Interesting Quotes and Stories
"It's extremely anti-intuitive in the world of modern software where there is a bazillion layers of things and now it's very much unclear what is costing things. That happens in the smallest shops and the biggest shops. So the tools are very important." -- Pablo Galindo Salgado
"You don't need to be a profiler expert to know that if you're doing extra work to measure the work, that is going to skew the results. Now you're not measuring your application, you're measuring your application and the profiler at the same time." -- Pablo Galindo Salgado
"If this was quantum mechanics, before you actually measure your program, your program is both fast and slow at the same time." -- Pablo Galindo Salgado, putting on his physicist hat after Michael's Schrödinger analogy
"Hey, László, would it be cool to call this in a loop? And then we have a profiler." -- Pablo Galindo Salgado, at the PyCon US 2025 sprints
"We literally spent the entire rest of the sprint working on it. And I think we actually ended up with no code committed during the sprint. All of the actual commits went in later on." -- László Kiss Kollár
"We ensure that this is a feature that Python offers and will never break. If we can do it, then anyone can do it." -- Pablo Galindo Salgado, on why the profiler belongs in the standard library
"We have an extra trick that they don't have, which is that we also control the interpreter. So now we could do changes to the interpreter with the only purpose to ensure the profiling is faster." -- Pablo Galindo Salgado
"You never know how your application is really going to behave or what is slow until you measure the real deal. You cannot measure the fake deal." -- Pablo Galindo Salgado
"If I showed you the code, no person on the planet will see it. It's so ridiculously complicated to see. But we could see it as clear as day on the data." -- Pablo Galindo Salgado, on the accidentally quadratic algorithm that was burning a core on every machine at HRT
"It's not always the case that you have access to that in the worst possible time when things are blowing up. It's the opposite. You don't have these tools ready when you realize that you need it. And what's amazing about this is that all you need is to have 3.15 installed." -- László Kiss Kollár
"By observing it, you've changed it." -- Michael Kennedy, on how tracing profilers distort the programs they measure
"I was certain something was happening with my program making it slow. And then I attached a profiler and it wasn't even closely related. I was using the wrong data structure instead of the 6,000 lines of complex mathematical stuff that I thought was slow." -- Michael Kennedy
"Most people call it Tachyon. That's the real name. The other one is the name that you need to use when you go to boring meetings with suits." -- Pablo Galindo Salgado
The name and the logo. A tachyon is a hypothetical particle that travels faster than light. Special relativity does not forbid it; it says light moves at exactly light speed, massive things must stay below it, and something could in principle live above it, though such a particle would travel backwards in time, which is one reason nobody expects to find one. The prefix "tachy" is Greek for fast. Cronon, the sibling profiler, is named for the chronon, the hypothetical quantum of time. The Tachyon logo was drawn by Maya Jiménez, an ML researcher at Google DeepMind and an artist who also created the Python 3.10 and 3.11 release logos.
Crossing the desert. When Michael worried that library authors have been sheltered from real threading bugs by the GIL, he compared it to crossing a desert in a car versus on a bicycle. Pablo agreed: people do not realize how nice the air conditioning was until they get out of the car.
Key Definitions and Terms
- Sampling profiler: A profiler that periodically captures a snapshot of the program's call stack at a fixed rate (say 1,000 times per second) and builds a statistical picture of where time goes. Low overhead, approximate counts. Tachyon, py-spy, and Austin are sampling profilers.
- Tracing profiler: A profiler that hooks every function call and return and records each one. Exact counts, but it runs inside the process and slows it substantially.
profile,cProfile, and Memray are tracing profilers. - Tachyon: The name of the sampling profiler in Python 3.15, exposed as the
profiling.samplingmodule. Named after the hypothetical faster-than-light particle. - profiling.tracing: The new home of cProfile under PEP 799. The
cProfileimport remains for compatibility; the pure-Pythonprofilemodule is deprecated and slated for removal in 3.17. - PEP 768: The safe external debugger interface added in Python 3.14 that lets an outside process inspect a running CPython interpreter. It was built so pdb could attach to live processes and is the foundation Tachyon samples through.
- PEP 799: The PEP that introduces the
profilingpackage withtracingandsamplingsub-modules. - Attach: Connecting a profiler to an already running process by its PID without restarting it, as opposed to launching the program under the profiler.
- Dump mode: A Tachyon subcommand that prints a single stack trace of a live process by PID, useful for diagnosing a hang or deadlock.
- Wall-clock time: Elapsed real time, including time spent sleeping or waiting for I/O. Tachyon's default mode.
- CPU time: Time the program is actually executing on the CPU, excluding waits. Tachyon's CPU mode filters samples to these.
- GIL mode: A Tachyon mode that keeps only samples taken while the thread holds the Global Interpreter Lock, revealing which code blocks other threads from running.
- Exception mode: A Tachyon mode that measures time spent raising and handling exceptions, including internal uses like StopIteration in the iterator protocol.
- --blocking: A Tachyon flag that briefly pauses the target process for each sample so every read is consistent, at a cost of roughly 1% to 2% at normal sampling rates.
- Partial read: A sample captured while the target's data structures are mid-change. Tachyon detects and discards most of these when not in blocking mode.
- Flame graph: A visualization of stacked call frames where width is proportional to time spent, letting you spot hot paths at a glance.
- Differential flame graph: A flame graph comparing two profiles, highlighting which functions got faster or slower between runs.
- Heat map: A Tachyon output that colors individual source lines by how much time they consumed.
- Gecko format: A profile output format that includes per-thread timelines; Tachyon's "all" mode uses it to show which thread held the GIL and when.
- Event loop: The scheduler at the heart of asyncio that runs coroutines cooperatively on one thread and wakes them when their I/O is ready.
- Explicit lazy imports: A Python 3.15 feature where
lazy import moduledefers loading a module until it is first used, saving startup time and memory. - gc.freeze(): A garbage collector call that moves existing objects out of future collections, popularized by Instagram to make forked web workers faster.
- Free-threaded Python: The build of CPython without the GIL, allowing true parallel execution of Python threads.
- Chronon: In some quantum theories, the hypothetical smallest unit of time. The namesake of Cronon, Pablo's native-aware profiler at HRT.
Learning Resources
If this episode has you wanting to go deeper on how Python actually spends its time and memory, here are a few places to continue. These courses pair well with the ideas in the conversation, from interpreter internals to the concurrency models Tachyon's modes are built to inspect.
Python Memory Management and Tips: Pablo's second-order argument for lazy imports, that every unused object makes the garbage collector slower, is exactly the kind of thing this course makes concrete. It covers reference counting, the generational GC, and practical ways to make Python code use less memory and run faster, with real code rather than theory.
Async Techniques and Examples in Python: Tachyon's async-aware mode and its GIL mode only make sense if you understand the event loop, threads, and the GIL. This course walks the full spectrum of Python concurrency, from asyncio to threading to multiprocessing, and is the right background for interpreting what those profiler modes are telling you.
Python for Absolute Beginners: If the talk of call stacks and interpreters was a stretch, start here. This is the foundational course for people new to programming with Python, and it builds the mental models that make everything in this episode approachable later.
Overall Takeaway
The lesson Michael opened with is the one the whole episode circles back to: the thing you are sure is slow usually is not, and the only way to know is to measure. For most of Python's history, measuring meant either a tracing profiler that made your program several times slower and distorted what it measured, or a third-party tool that had to reverse engineer the interpreter and broke with every release. Tachyon changes both halves of that. It is a sampling profiler that reads a running process from the outside at near-zero cost, it lives inside CPython so the core team is now on the hook for keeping it working, and it comes with the kind of output, from a plain list of slow functions to async task graphs and GIL timelines, that used to require a whole toolbox. Pablo and László built it at a sprint by asking a simple question, "what if we called the debugger interface in a loop?", and then refused to stop until two samples per second became more than a million. The advice they left listeners with is just as simple: install 3.15 in October, attach Tachyon to something real, and look. As Pablo put it, the data is almost cheating; it tells you what to change. You might free a core on every machine. You might just find out you needed a set instead of a list. Either way, you will stop guessing.
Links from the show
László Kiss Kollár: linkedin.com
Pablo Galindo Salgado
3.11: talkpython.fm
Memray: talkpython.fm
PyStack: talkpython.fm
profile and cProfile: docs.python.org
py-spy: github.com
Austin: github.com
PEP 799: peps.python.org
PEP 768: peps.python.org
PyCon US 2026 talk: us.pycon.org
The docs: docs.python.org
Backport to 3.14: github.com
Watch this episode on YouTube: youtube.com
Episode #565 deep-dive: talkpython.fm/565
Episode transcripts: talkpython.fm
Theme Song: Developer Rap
🥁 Served in a Flask 🎸: talkpython.fm/flasksong
---== Don't be a stranger ==---
YouTube: youtube.com/@talkpython
Bluesky: @talkpython.fm
Mastodon: @talkpython@fosstodon.org
X.com: @talkpython
Michael on Bluesky: @mkennedy.codes
Michael on Mastodon: @mkennedy@fosstodon.org
Michael on X.com: @mkennedy
Episode Transcript
Collapse transcript
00:00 Do you know what's actually slow in your Python app?
00:02 Or are you just guessing?
00:03 Until now, profiling Python meant a tracing profiler that made your code two to three times slower,
00:10 or a third-party tool that broke with every new release of the Python runtime.
00:15 Python 3.15 fixes that.
00:17 It ships with Tachyon, a sampling profiler built into the standard library.
00:22 It attaches to live production apps with almost zero overhead.
00:26 My guests are Pablo Galindo Salgado, a CPython core developer and steering council member,
00:31 and Laszlo Kiskoller from Bloomberg's Python infrastructure team.
00:35 Their first prototype ran at two samples a second.
00:39 Now it can do over a million hertz sampling.
00:42 The best news is this lands in Python 3.15 today.
00:47 This is Talk Python To Me, episode 565, recorded September 16th, 2026.
01:11 Welcome to Talk Python To Me, the number one Python podcast for developers and data scientists.
01:16 This is your host, Michael Kennedy.
01:18 I'm a PSF fellow who's been coding for over 25 years.
01:22 Let's connect on social media.
01:24 You'll find me and Talk Python on Mastodon, Bluesky, and X.
01:27 The social links are all in your show notes.
01:30 You can find over 10 years of past episodes at talkpython.fm.
01:33 And if you want to be part of the show, you can join our recording live streams.
01:37 That's right.
01:38 We live stream the raw uncut version of each episode on YouTube.
01:41 Just visit talkpython.fm/youtube to see the schedule of upcoming events.
01:46 Be sure to subscribe there and press the bell so you'll get notified anytime we're recording.
01:50 This episode is brought to you by Sentry.
01:52 Sentry's new MCP server connects your error reports straight to your coding agent.
01:56 Claude Code reads the errors, finds the bugs, and fixes them.
02:00 Get started at talkpython.fm/sentry.
02:03 Pablo Laszlo, welcome to Talk Python Week.
02:06 Pablo, welcome back.
02:07 Always good to have you on the show.
02:08 Laszlo, hello.
02:09 Yeah, thank you very much.
02:11 Yeah, it's good to see you both.
02:12 I'm really excited to talk about profilers.
02:14 I've had very extreme examples.
02:18 Extreme examples.
02:19 Extreme experiences with profiling.
02:21 experiences. Because I was certain, Pablo, I was certain something was happening with my program,
02:28 making it slow.
02:29 And then I attached a profiler and it wasn't even closely related. It was just
02:35 something completely else.
02:36 I was using the wrong data structure instead of the 6,000 lines of complex mathematical stuff that I thought was slow. And it's really saved the day because I would
02:46 have tried to rewrite stuff that was super complicated. And really all I needed to do
02:50 with something silly like switch from a dictionary or a list to a set or a list to a dictionary,
02:54 something like this, right?
02:55 And it's like, wow, it's just like list find or list index sort of thing.
02:59 Oh, my gosh.
03:00 Yeah, many such cases.
03:03 Yes, yes, yes.
03:05 I think it's more common than you will think, right?
03:07 Like, I know that when this happens, it's going to feel a bit bad because it's like,
03:11 oh, man, I'm stupid.
03:12 But like, no, it's extremely anti-intuitive in the world of modern software
03:16 when there is a bazillion layers of things and now it's very much unclear what is costing things.
03:22 And that happens everywhere.
03:24 That happens in the smallest shops and the biggest shops.
03:27 So the tools are very important.
03:30 Yeah, they absolutely are.
03:31 And you all are behind some really cool new profiling capabilities coming into Python.
03:37 Yes, yes.
03:38 Looking forward to diving into that with you.
03:40 So let's just do a quick reintroduction for you, Pablo.
03:44 Just tell people about yourself a little bit, what you've been up to.
03:46 It's been a while since you've been on the show.
03:48 Yes, but always, always been a lot of fun to be here.
03:51 So like, let's do more, let's do more.
03:52 But let me keep going and do more profilers so we can come here even more time.
03:58 That's my goal, just doing more profilers to come here.
04:02 So yes, I think last time we talked about perhaps PyStack or Membray, one of the two.
04:06 I don't remember the last one.
04:08 We spoke about both.
04:08 I don't remember the order.
04:10 Yeah, exactly.
04:11 Yeah, but yeah.
04:12 So yeah, since then, I think, Yeah, a bunch of things have changed.
04:15 I think, you know, a bunch of Python releases since then.
04:19 We are now in very close to 3.15.
04:22 It's very hard.
04:23 You will think, like, people know it is the last version, but in my mind, 3.15 is all news
04:27 because the main branch is 3.16.
04:29 So, like, it's like all stuff.
04:30 It's like, oh, is that released already?
04:32 Anyway, no, 3.15 on October.
04:34 I'm sure you will do a very good episode about that so, you know, people should listen to it.
04:38 Yeah, yeah.
04:39 We've done before, like, kind of a launch event thing around Python.
04:44 I think it was 3.13, 3.12.
04:47 I can't remember which one, but that was a lot of fun.
04:48 Are you involved in the release this year?
04:51 I mean, from the sidelines, I still release my versions, 3.10 and 3.11, but the release manager right now is Hugo Pankeminade,
04:57 and the next is going to be Savannah, which is going to be the new release manager for 3.16 and 3.17.
05:05 So I just help in.
05:06 I mean, there's always, like, things to fix, and certainly since I'm the author of a bunch of stabbing 3.15,
05:13 quite a lot of stuff actually, like, you know, lazy imports and the profiler.
05:16 So like there's a bunch of broken stuff.
05:19 So yeah, that does, that's, you know, I'll help it.
05:22 Yeah.
05:22 Yeah.
05:23 So apart from that, I don't know, I, you know, same things.
05:25 I think the last time are still true, you know, core developer.
05:28 I was still in the stream console.
05:30 I think I'm furniture at this point.
05:31 I feel like I've been there for like six years already.
05:33 So I don't know.
05:34 Maybe it's time to, to, to, to reconsider.
05:38 But yeah, I think the only thing is new is that I changed employers.
05:41 I used to work for Bloomberg, which is with Laszlo.
05:43 I used to work there.
05:45 And this actually, the provider work started when I was at Bloomberg.
05:48 But now I'm, I betrayed Bloomberg.
05:50 And now I'm in Hudson River trading.
05:53 Hudson River trading.
05:54 Bam.
05:55 Doing like fast trading.
05:57 Lots of money.
05:58 Yes, yes.
05:59 And that's very exciting.
06:00 Also, probably a little high stress, but that's okay.
06:02 No, I'm chill.
06:03 Like, you know, they let me record this podcast.
06:06 Well, I'm just meaning like, if you remove a lot of money, that is a nerve wracking thing.
06:10 It's more like the stress I think is more like what happens when you screw up because like a bloomer I think you screw up and you know maybe your manager says bad bad bad developer you know but like it's fine and I can talk about bloomer this way because I'm not worried anymore.
06:25 But sorry guys.
06:26 You're going to make this interesting for me Pablo.
06:28 Yes.
06:28 Sorry Chime.
06:30 This guy.
06:31 Anyway.
06:33 But yeah here is like when you screw up there is a very scary number that comes with the build you know.
06:38 and like your little deployment failure caused like sort of big numbers.
06:44 So you're like, shit, damn.
06:47 So when that number, you know, it's very high, then, you know, so it's scary.
06:51 So, yeah, I don't know.
06:52 It keeps interesting.
06:53 I find it.
06:53 Yeah, but after you release Python to how many tens of millions or more people
06:59 and platforms and it's low state.
07:02 I mean, that's also a big deal.
07:04 I'm used to it.
07:04 I'm used to it.
07:05 This is just like high speed.
07:08 high speed.
07:09 Like in Python, when you screw up, you know, it's after a year that people use your thing
07:13 and they say, oh, you know, lazy imports is bad. And then you say, damn.
07:17 They're not going to say that. Lazy imports are going to be awesome.
07:19 I'm for it.
07:20 That's it. That's it.
07:22 One of us. One of us.
07:24 But here, you know, like, they will tell you the millisecond it fails.
07:27 So you will know.
07:28 But yeah, last look. And, you know, also, quick shout out to core.py. That's a fun. Oh, thank you. I forgot.
07:34 I only have one job.
07:36 I only have one job.
07:37 I failed at the job.
07:38 Sorry, Lucas.
07:38 Sorry, Lucas.
07:40 Yeah, Lucas, run that.
07:41 That's a great, that's a fun deep dive.
07:43 Like core developer internals.
07:45 Yes, yes.
07:45 Listen to us.
07:46 We're still alive.
07:47 Lucas just like joined Meta and Mark Zuckerberg himself doesn't allow him to record that often.
07:53 Like that, when he joined Meta, Mark called him and was like, you cannot just, you cannot
07:57 just do this podcast often.
07:58 So like now we cannot do it.
07:59 It's like, if you're not going to have me on the show to talk about AI, we can do it.
08:03 Yeah, exactly.
08:03 So, but we have integrity.
08:04 We say, no, Mark, you cannot be on Corel.py because you don't talk about Python.
08:09 It's not a PHP show, man.
08:11 Come on.
08:11 Exactly.
08:12 Yeah, yeah.
08:13 Those guys.
08:14 So, yeah, yeah.
08:15 So we're still alive, just slower.
08:18 But listen to Corel.py in all platforms.
08:21 Solid.
08:22 Lazlo, welcome to the show.
08:23 Tell us about yourself.
08:24 Thanks.
08:24 Happy to be here.
08:25 So, yeah, so we've been working.
08:29 I have worked with Pablo for quite a few years.
08:31 Originally, I think since 2018, we started in the Python team together in Lundberg.
08:38 And up until the end of last year, we've worked together.
08:43 I actually participated in some of the projects like PyStack and Memory internally,
08:49 not nearly as much to the extent as in Tachyon.
08:52 But then we started collaborating with Pablo last year.
08:56 And I remember this because, you know, probably just mentioned, like, it seems like 315 years old.
09:01 I remember that we started working on this in the Sprint last year.
09:04 Picon last year.
09:05 Yeah, yeah.
09:06 Crazy.
09:06 April, May.
09:08 And it just seems like so far away.
09:11 And it's crazy that it's still not out.
09:14 But yeah, so that's where everything started.
09:16 But now that you have this thing fresh, like now, right?
09:19 Like the last year, you know, we were young and full of hope.
09:21 But like imagine the time when Python releases were every two years.
09:26 Oh, yeah.
09:26 Damn.
09:27 Damn.
09:28 Because you think, oh, man, 312, 313.
09:30 No, man.
09:31 from 3.8 to 3.9.
09:33 Well, 3.8 was the first one, but 3.7 to 3.8 was two years.
09:36 You forget everything about the feature.
09:38 You introduced ramp by the time it's released.
09:42 Exactly.
09:43 Do you guys think it should go faster?
09:44 Yeah.
09:45 Do you think there should be a six months or every three months version of Python that comes out?
09:50 Or is it not?
09:51 I think from the usability thing, I think I will do rolling releases if I could,
09:57 but the problem is that CPython is too big to like do that.
10:01 In the sense that stability is really hard.
10:04 In the sense that ideally in the ideal world, you merge things that aren't ready,
10:07 right?
10:07 And then you don't like, you know, merge half bike stuff.
10:10 But like, you know, for a software this complex, I like that affects so much things
10:15 and like so many people depend on it.
10:16 Of course, like people are going to run on the latest one, right?
10:19 But like, it's very unfortunate.
10:21 And from this thought that is obviously wrong to like the one year, two year release,
10:25 there is a continuum, right?
10:26 So like, where do you put the line?
10:28 But in our experience in the core team so far is that one year is already like running to the edges of,
10:35 you know, how much we can ensure.
10:38 Because like there's always some last time scare.
10:41 You know, there's always like, oh, you know, for example, in Python 3.12,
10:46 we have to revert an entire new GC implementation.
10:50 Right.
10:51 And now in Python 3.14, sorry, that was 3.13.
10:55 In Python 3.14, we have to revert it again.
10:57 So like, because it was like having a huge amount of memory impact and that was only
11:02 known after people started to use it.
11:04 So that gave us like some information that perhaps we are, or either way we need to look
11:09 at the process, which we are of course, but like, or one year is already like on the line
11:14 of what is responsible.
11:15 So, you know, it would be amazing if it's like rolling release and then you can get like
11:19 the features the next day, but not a possibility.
11:23 Yeah.
11:23 And I guess it doesn't change.
11:25 One of the things that's really nice about Python, honestly, is there's almost never a reason not to run on the new lease.
11:32 It's very, very stable.
11:34 Only once have I had a major release of Python break any of my apps.
11:40 And the reason was the async coroutine decorator was removed in lieu of async and await only for async funks, something like that.
11:50 Oh, I also didn't look at it.
11:51 Yeah.
11:52 And one of the libraries I was using for the database way deep down still used that.
11:58 And I didn't know.
11:59 But when I rolled out the new version, it's like, what are you talking about, decorator
12:03 async code routine?
12:03 I'm like, it just doesn't run.
12:05 I don't know.
12:05 This isn't great.
12:07 But that's not what happens.
12:08 And I guess the faster you go, the more likely that is to happen, right?
12:10 Yeah.
12:11 I think you're also lucky.
12:12 I think like for, I mean, I don't know.
12:14 I don't want to assume.
12:15 But I suppose my experience, for instance, working at Bloomberg and also here is not
12:20 really the same.
12:21 when your software is big enough, you will run into the sync decorators all the time.
12:26 You know what I mean?
12:27 And in the weirdest cases, normally it's not even just Python.
12:31 It's like, oh, this Python 3.15 requires you to upgrade your Pandas data science stack
12:37 because the NumPy only supports 3.15 in version 2.5, right?
12:41 So if you're running version 2, that forces you to move 0.5, sorry, five versions of NumPy or whatever it is.
12:48 And then, I don't know, you run into all sorts of things, right?
12:50 Like here, the work I do right now in HRT, we have a lot of numeric work, for instance.
12:56 And there is times when we upgrade the interpreter and nothing breaks in the sense that,
13:01 you know, this function doesn't exist or this doesn't work.
13:04 It's like, no, like the floating points are slightly off, you know, like so the simulation is slightly off.
13:11 And, you know, you chase that down and it's like pandas changed slightly the algorithm and like nothing,
13:17 you know.
13:19 like maybe the compiler is slightly different or something or like a compiler optimization flag
13:26 so people you know they still are relatively major events even if in the core team we've been working
13:32 with for instance numpy and pandas to ensure that they have wheels now on release so when you you
13:37 know when you start 315 uh and they won we won for can use no buy and it used to be not true right
13:43 3.8 that was not a thing but now it is yeah it's certainly that uh the deploying of packages is
13:49 I want to talk about a couple things as a way to kind of introduce, work our way into performance and profiling and so on.
13:57 And since you brought it up, let's talk real quick about lazy imports, explicit lazy imports.
14:03 Explicit.
14:03 Yeah.
14:04 Well, by the way, did you consider not explicit?
14:07 Of course, yeah.
14:07 And that was rejected.
14:09 I wonder why.
14:11 So what does the syntax even look like?
14:13 Yeah, yeah.
14:13 So you just put lazy import to your import and bam, your problem is faster.
14:17 Isn't that cool?
14:18 Well, asterisk, no, but that's the selling point.
14:23 Well, okay.
14:23 The guess is that, you know, so Python, one of the powers of Python is very unsurprising
14:29 is packaging, right?
14:30 Like you have a package for everything, but guess what?
14:34 Those packages also use packages for everything and so on and so forth until you download is
14:40 even, you know, and like just to check if a number is even, you just download a package
14:43 or something.
14:44 So what happens is that because this library is packaged a bunch of functionality,
14:48 sometimes when you only want to reach for a tiny function in some package,
14:51 you end importing the entire thing, right?
14:54 And the entire thing will end importing the entire thing of other packages and so on and so forth.
14:59 So it's very common that just by importing a tiny function, you end paying for the entire world.
15:05 And some of those imports are really slow, unfortunately, because like they need to load big files or anyone that has dealt with Torch knows how chunky the video wheels are and whatnot.
15:15 So, you know, that's bad because you should only pay for what you use.
15:17 So the idea of explicit lazy imports is that, you know, if people start to mark the imports as lazy,
15:23 that you will only pay for the imports that you really need.
15:26 So only when you actually need that thing, then it will be imported.
15:29 And that transforms your mega graph of imports of things that you don't really need into only the ones that you need.
15:35 And that saves you a lot of time and memory, right?
15:37 Because loading those things is not free.
15:40 Not only in time, right?
15:40 It's in memory as well.
15:41 Yeah.
15:42 Honestly, I think, I mean, there are, speaking of profilers, there are some tools.
15:47 Now, this is not a very popular one.
15:49 It's very old.
15:49 I don't know if it even works.
15:50 But there are some tools to do things like profile import time and so on.
15:55 Certainly the time can matter.
15:57 I guess it matters.
15:58 It depends on what you're doing.
16:00 If you're doing serverless, if you're doing CLIs, if you're doing subprocessing,
16:04 those kinds of things really matter because it's spin up the thing, do a little bit of work
16:08 and go away.
16:09 If it's a web app, you know, startup and then it just chills, right?
16:13 It doesn't really matter in terms of time.
16:14 But I'll tell you where it does matter a lot is memory.
16:17 Right, right.
16:18 I was on a mission to reduce how much memory it takes to run like the Talk Python courses
16:23 site and all the different things.
16:24 And I was surprised a couple hundred megabytes were ports that were rarely used.
16:30 So maybe if I run some back-end admin, it would pull up NumPy, Matplotlib, and other types of stuff, right?
16:38 But otherwise it wouldn't.
16:39 And that added at least 100 megabytes to the runtime.
16:42 And because the way the imports worked, everything was eager.
16:45 It basically imported everything at startup.
16:47 So just by having those import statements there, the app was using 100 megabytes more than it needed.
16:53 I changed them to the best I could of lazy imports, where you just import in the function instead of the top of the file.
16:59 Lazy imports at home.
17:00 Yeah, like homegrown, homebrew lazy imports.
17:04 And it really dropped the memory by 100 megabytes.
17:07 And on the server, that's one of the most expensive things is RAM, not compute.
17:12 I was going to say that there's one more, I think, super cool area where lazy imports help a lot,
17:18 which is CLI tools, which typically can be, and we've seen a lot of this,
17:22 And I know with Pablo, we actually even looked at some stuff at work in the past where once
17:26 you have a complex enough application, but you literally just want to see the help page
17:31 or just spin something up and it can take seconds.
17:35 And lazy imports can make a massive difference in that sort of the responsiveness of that
17:39 CLI tool.
17:40 Right.
17:40 I was going to just add that there is also second and third order effects that people
17:45 think about, but depending on the size of your thing can be quite dire.
17:49 Like one story, for instance, for my current employer is that even if you don't care about memory,
17:55 let's say you have all the memory in the world, right?
17:57 And let's say you don't care about the startup tag, because like you said, like,
18:01 you know, you have a web app, right?
18:02 And like, you just start your thing and that's fine.
18:05 What can happen still is that if you import a lot of stuff that you don't use, all those imports will bring into existence a bunch of like a lot of Python objects.
18:14 And those objects can be classes, functions, constants, and, you know, like all sorts of things.
18:21 And those things will be more and more and more and more.
18:23 And so you end with a lot of Python objects in your, you know, in your program that you don't use, right?
18:29 And those things have non-zero costs because every time the garbage collector runs,
18:33 it will, like, look at all those things and then every run of the garbage collector will be slower.
18:38 Of course, like, you know, you have a web app that is a solution like the Instagram GC Freeze
18:43 that they implemented, but this will happen also, you don't have web apps.
18:46 Like you have like even like the case of my employee, like scientific computing,
18:51 and you are crunching out of numbers just by importing stuff that you don't use,
18:54 those numbers will be crunched slower.
18:55 And you cannot just DC freeze because you don't have like a fork model that then you run your workers,
19:02 right?
19:03 So importing less will make these objects not exist, and therefore the app will run more linear.
19:10 That's the key, right?
19:11 So there is like very interesting second and third order effects to this.
19:15 This portion of Talk Python is brought to you by Sentry.
19:18 Now, I've told you about Sentry many times on the show, but this time I have something new that should be very exciting to you.
19:25 Sentry has recently released their MCP server.
19:28 And for me personally, this has truly unlocked a new level of integration
19:32 and workflow with Sentry.
19:33 You see, Sentry is integrated into Talk Python, courses, website, the mobile app,
19:39 and a whole bunch of things behind the scenes no one ever sees.
19:43 When something goes wrong in any of these apps, I'm alerted immediately over email,
19:46 and I can log into Sentry and see all the details of what happened, the parameters that were passed to functions,
19:51 what user encountered this error, and much more.
19:54 Traditionally, what I would do is I would read the stack trace, open up the source code,
19:59 try to piece together the detective story that would solve what was wrong with my code.
20:03 Once I figured it out, I would fix the code and push out a new version.
20:07 But you know what's coming, right?
20:08 It's 2026.
20:09 This is the kind of work that AI is spectacularly good at.
20:14 Now when there's an error, I simply open up Claude Code with the project that had the error,
20:18 and I tell Claude, we have new errors in Sentry.
20:21 Please investigate them, and if you can, solve them.
20:24 Claude immediately knows to use Sentry's MCP server because I connected it to
20:28 Claude Code.
20:29 It investigates all the errors, uses the information I discussed, and much more,
20:33 as well as the code base it's working in.
20:36 And 99% of the time, it fixes this without another instruction from me.
20:41 The magic of Sentry's MCP server is that it gives you full Sentry error reporting
20:46 and management directly connected to Frontier models running inside your code base.
20:51 If you use Agentic AI for your code at all, you definitely need to check out Sentry and connect Sentry's MCP server
20:57 straight to your favorite coding agent.
20:59 Get started today at Sentry.
21:00 Be sure to use our link and discount code.
21:03 It's talkpython.fm/sentry, code talkpython26.
21:08 That's talkpython.fm/sentry.
21:10 It gives you extra credits, but more importantly, it lets Sentry know you came from us.
21:14 Thank you to Sentry for supporting Talk Python To Me.
21:17 Python does a bunch to try to keep the memory together, arenas and blocks and all that kind of business.
21:23 But yeah, if you allocate a whole bunch of pointers, all of a sudden the GC has to count them, right?
21:28 Right.
21:28 The Gen 2 collections, yeah.
21:30 Okay.
21:31 Well, I'm excited for it.
21:32 So everyone get ready to write lazy import module instead of just import module and see where it takes you.
21:38 Yes.
21:39 All right.
21:39 Also, let's talk faster CPython a little bit.
21:43 All right.
21:44 I mean, we're talking profiling.
21:46 We're talking about making code faster.
21:48 The Faster CPython initiative, even though it's gone through a little bit of organizational challenges.
21:54 Drop my life, yeah.
21:55 Yeah, like with the Microsoft pulling the support or the people off of the project or whatever.
22:00 I think it's been a huge success.
22:02 I think Python is so much faster in a lot of ways.
22:05 And yeah, what are your thoughts?
22:07 Either of you.
22:08 Yeah, I think, I mean, it's pretty obvious if you look at like the performance of like,
22:13 let's say 39, that was when this started, or like 310 perhaps, like on the performance of today's Python,
22:19 like that has been a clear success.
22:21 And this kind of continues.
22:22 It's just that like we just run out of like obvious things.
22:26 Obvious doesn't mean easy, right?
22:27 But like obvious things to look at.
22:29 And right now, the biggest efforts are into big chunks of this work, like JIT, which is like, you know, a big piece of software.
22:35 I think you got Brandon in the show, perhaps, in the past, to talk about it.
22:40 So now, you know, that's something that you cannot just commit in a couple of months.
22:45 Pips are needed and all sorts of things.
22:47 So right now, you know, the successor of that project is still happening.
22:51 It's just that now those optimizations are much harder and require more careful consideration.
22:56 And as you very well know, we are also very deep into the weeds of free threading and free thread Python dropping the GIL.
23:04 And, you know, it turns out that those things kind of like don't play necessarily well together.
23:08 So there is also like, you know, a lot of considerations there.
23:12 And going to the topic at hand, profiling is really important to ensure that like none of this gets wrong.
23:18 Right.
23:18 And to also know that indeed your application became faster.
23:23 Why?
23:23 Because, like, you know, is this because Python 3.15 is going to be faster or is it because, like, NumPy is faster?
23:29 Like, how do you know?
23:30 Well, you need to use one of these tools, right?
23:32 Yeah.
23:32 Vaslo?
23:33 Yeah, I mean, I watched the sort of the fastest SuperTor project from the sidewings for the past couple of years.
23:41 And I think the, I actually remember, I think the biggest jump, was it 3.12?
23:46 there was a very significant jump there.
23:48 And it was very exciting because when we introduced that version, there was such a significant jump that whereas,
23:55 you know, oftentimes you would have to convince folks, like you need to upgrade your Python versions,
24:00 right?
24:01 But when you have this carrot, where you have literally a 30-40% performance jump just for free,
24:06 basically, that just made it a lot more appealing.
24:08 And I think it opened up a lot more areas where Python became competitive and more appealing.
24:14 So I think, yeah, I mean, I shared sort of what Paul mentioned about the complexity,
24:22 sort of the JIT coming in, no-gil Python.
24:26 I think it's quite a bit challenging now, I think, to look at these performance improvements.
24:32 I mean, I have a lot of faith in the JIT compiler, you know, making significant performance improvements.
24:39 I'm not sure exactly how exactly it's going to work.
24:44 I have a lot of compilers as well, I think.
24:46 Compilers are pretty awesome.
24:47 Some stuff out of the C eval, which for statement, that would be good, you know?
24:53 Yep.
24:53 Yeah, and I think at the same time, it's also not forgetting that free trading Python has the potential to provide very significant speedups,
25:03 right?
25:03 It really depends on the application and the domain.
25:07 But I think we can actually see very significant speedups and we can see like certain extensions and performance sensitive libraries can produce very significant speedups.
25:18 And I think that's like sort of, I guess what we're seeing is now it's going into in multiple different directions,
25:22 depending on your application.
25:24 You can benefit from free threading potentially a lot more than, for example, waiting for a JIT profiler to go further.
25:31 Yeah, I'm really excited about the free threading stuff.
25:33 I think it has tons of potential, but I'm also concerned.
25:37 I feel like a lot of the people building libraries and packages for Python have not deeply thought about race conditions.
25:44 And I think just because they've assumed, well, the gil and generally single threaded,
25:48 at least effectively, even if they have threads, so whatever.
25:52 And then they're going to say, oh, it's free.
25:54 We got these bug reports from free threading.
25:56 So we're going to add locks.
25:57 And then you're going to have deadlocks in your application.
25:59 I just, I feel like there's going to be a couple of waves of growing pains and I don't know.
26:04 Yeah.
26:05 Yeah.
26:05 And part of that is like intrinsic to the porn in particular, you know, there is a lot
26:10 of jokes in the internet about like threads being complicated.
26:13 And I think people in the Python ecosystem have not been exposed to what that really
26:17 means because sure.
26:19 Yeah.
26:19 I mean, you, you, you have some problems with threads in Python, but like most of the real
26:22 problems are not really exposed to you.
26:24 While now, you know, there is two problems that you need to suffer.
26:27 One of them is like, you know, you are not tall enough to do multiple threading, which was the joke,
26:33 right?
26:33 And then the other one is that, you know, free thread may be buggy just because there's bugs in the interpreter,
26:39 hopefully not, but also maybe bugs in the packages, right?
26:43 Or like the other problem that we can see a lot of people running into sometimes is that it doesn't scale linearly.
26:51 Like it's not magic.
26:52 Again, this is a matter of threading, it's not easy.
26:54 and sometimes you know the cost of not crashing and the multiple threads is that extra checks
27:00 need to be done and those extra checks make your use of multiple threading not work and
27:05 people are not getting used to profile that thing as well so you know like it's very hard to
27:11 understand why your algorithm that should be scaling with number of threads is not scaling
27:16 because now you need different tools and not even the tool that we're going to talk about today
27:20 works in that case right so you need to like people people need to be really careful with that i like
27:25 your analogy of like yeah you're using threadings but you've kind of been sheltered it's like oh yeah
27:30 i i traversed the desert car versus on a bicycle right it's yeah you it's not the same experience
27:37 of going through the desert in a car like oh it is hot exactly exactly yeah yeah yeah and people
27:43 don't know you know they don't know how fresh that the car was when they were towards in the desert
27:48 right uh but the deal it made so everything so easy right with uh right is your ac ac in your uh
27:59 onda you know desert on that all right exactly yeah all right so so then let's talk profiling so
28:06 i think maybe a quick history of profilers in python we've got the more advanced sort of external ones
28:13 like memory and so on but let's let's just focus on what i always thought was a little bit of a
28:17 weird distinction that there's two profilers, the C profile and the just profile in Python.
28:23 Yeah.
28:24 I just pick one, but tell us, this is what we've had for quite a while.
28:28 I've done a lot with these.
28:30 So, yeah, this is like, it's kind of weird to say today where like, you know,
28:35 so many people are using Python and Python is so big that what we're going to explain here is a
28:39 bit like, you know, it sounds strange, but so it used to be a time where like,
28:44 you know, the bar for the modules was much lower.
28:48 So the profile module, I mean, you know, it's a different time.
28:52 I'm not saying I will not do that, right? But like the quality of the tools that we're using
28:56 today, not just profilers in general, it's under much more scrutiny because,
29:01 you know, it serves more people and those people have like more demanding workflows.
29:04 And this is true, right?
29:05 The software that was written long, long ago had less complexity to deal with because,
29:09 you know, computers were not that, you know, powerful and like the stack was like saluer,
29:14 right?
29:14 So the profile module was the first attempt that people tried to do profiling in Python.
29:19 It's a very good attempt, so like, oh, it's actually good.
29:21 The problem is architecturally speaking, it's not really a good profiler in general.
29:25 The reason is because it's written in Python and it runs inside application that is being profiled.
29:30 So you don't need to be a profiler expert to know that you're doing extra work to measure the work that is going to skew the results, right?
29:37 Because now you're not measuring your application.
29:39 You're measuring your application and the profiler at the same time, right?
29:42 So that was bad.
29:44 And then this profiler module kind of like does a bunch of tricks to try to measure how much itself is contributing to the problem.
29:50 But like you can imagine how flaky that is.
29:54 And then the other problem is that it makes your application much slower because it's being measured, right?
29:59 And the other slowness was like huge.
30:01 Like we're talking about like 20 times slower and things like that.
30:04 Or like, you know, depending on what you're doing.
30:06 So part of the reason as well, again, is because the profiler itself was written in Python.
30:10 So perhaps, you know, that was not a great experience.
30:16 So the C profile module, which, you know, is very explicit about what is a trick,
30:21 but like, unfortunately, it's a leaky name because like the C in the C profile is the C language, right?
30:27 And also, it has one of the biggest problems that I don't like this module is that the C is lowercase and the P is uppercase.
30:34 And the name of the stupid module is like this.
30:36 So writing the thing is very annoying.
30:39 I always forget which one is uppercase and lowercase.
30:41 Anyway, so the C profile is basically a re-implementation of the profile module in C,
30:46 the illegal language.
30:47 And then many people don't know why I say this.
30:50 This is because the White House released this hyper thing that C was now dangerous because,
30:55 you know, it's like memory unsafe.
30:57 So I find very funny that the White House said that C is illegal and CPython is,
31:04 we are all, you know, like bandits writing in the illegal language.
31:08 Exactly.
31:09 Yeah, yeah.
31:10 Okay, so-
31:10 Living underground, hiding from everything with your GCC and your clang.
31:17 Exactly.
31:17 Give food to your core developer underground.
31:19 Yeah, yeah.
31:20 At least Seth and team were able to get Python on the good list.
31:25 Oh, yeah, yeah, yeah.
31:26 We both like that also.
31:28 Memory-safe.
31:29 And I was like, everybody's like, yeah, yeah, of course, Python is memory-safe.
31:32 And I was like thinking, is it?
31:33 They're like, I don't know, man.
31:35 I see a lot of bugs, but like, okay, okay, we are allowed to have bugs, you know, like Rust as well can have bugs and crash,
31:41 maybe less, but, you know, in theory, the language is very safe if you assume that there's no bugs.
31:46 Anyway, so C profile is this like implementation of the whole tree bank in C.
31:52 So it's faster than profile, actually, it's 10 times faster or so.
31:56 But it still, again, has the same problem, just less. So it makes your application still two or three times slower,
32:02 something like that, which is already huge, right?
32:04 Like thinking that your application takes five minutes, now it takes 15 minutes, right?
32:08 So not great.
32:09 And also the problem is that it also runs in the process.
32:13 So I don't want to get the impression that this is just negative.
32:17 So because now Cprofile is actually, it's well architecture, it's now in C,
32:22 so it's all good.
32:23 And now the problems in the slowdowns are an inherited property of these kind of tools,
32:28 right?
32:28 Because that run inside the profiler.
32:30 These are called tracing profilers.
32:32 The reason they are called tracing profilers because they see every single call that is happening,
32:37 right?
32:37 So every time you call a function, they see that and they need to record that.
32:40 So it's a lot of work to do, but also because they run in the process, every time you call a function,
32:46 now you do this extra work and then therefore your thing is worse.
32:49 The bright side, of course, is that you collect everything.
32:53 So if you want to know how many times your progress is calling, send money to employees,
32:57 you will know how much money are you selling to employees.
32:59 You are not missing it.
33:01 If it says seven times, it was called seven times.
33:03 Yeah, it wasn't just a statistical analysis, yeah.
33:06 Exactly, exactly.
33:07 So you can tell your employees that were not paid that that was not the reason,
33:10 right?
33:10 So in that case, then, it's really good for that.
33:13 The same way Membray, for example, if you recall, Membray is also a tracing profiler
33:18 because, you know, imagine that you lose a one gigabyte allocation.
33:21 Can you imagine that, oh, well, we just lose that one.
33:24 And, like, you know, I suppose your application is fine.
33:26 Like, you don't want that, right?
33:27 Like, you want Membray to tell you exactly everything that happened.
33:30 In time, it's different, right?
33:31 because like we will talk about that in a second, Laszlo will explain, but, you know,
33:35 here, that's the advantage of Zprofile still even today because, you know,
33:40 perhaps people will hear today's episode and say, well, Zprofile is not good anymore.
33:43 We should throw it away, but it still has its own use cases.
33:47 So that is, I think, a brief story of like why we have to...
33:50 Laszlo, what do you want to add to that?
33:52 Yeah, so I think it's definitely, I think, a problem with the ergonomics as well.
33:57 And if you're a developer and you want to provide a Python application, And I think if you look at the documentation,
34:03 I, when I first looked at this, found it very confusing.
34:06 How do I decide whether it's Cprofile or Profile, right?
34:08 And then I think it just became sort of the defacto standard.
34:12 You just always use Cprofile, right?
34:14 Why exactly it's unclear, right?
34:16 So I think, but I also think that there haven't been, like CPI didn't have obviously something profiling
34:23 and it didn't have powerful profiling tools.
34:25 So you always had to look for external tools to get actually like higher quality sort of profiling results.
34:32 And of course, there's an entire family of situations where you cannot use a tracing profiler
34:39 because effectively for a tracing profiler, you have to reconstruct a small sample test.
34:44 You cannot run that on your application, right?
34:47 Because it would just be too slow.
34:50 It's too time consuming.
34:51 So generally you would just have a test case or something and run it on that.
34:55 Yeah, the worst of that is It doesn't work great in production, but I profiled it locally and it seems okay.
35:02 So what's going on, right?
35:03 Exactly.
35:04 You can't really reproduce the exact same situation oftentimes.
35:07 And then you're basically left with no options or you have to start downloading,
35:12 finding some third-party option.
35:14 I can't, Pablo, I got to circle back to this a little bit because I think it's really interesting.
35:20 So you talked about the tracing profilers, which C profile and profile is,
35:25 and how it makes, they're very accurate, but they make a big impact on basically what is happening with your code.
35:32 And it reminds me of quantum mechanics a little bit.
35:35 Wow.
35:35 Let's go.
35:36 Let's go.
35:37 It's like there might've been a function.
35:39 Let's take two functions.
35:40 They each take half a second in practice on their own, right?
35:43 One of them has to do something with a file system a million times in a loop.
35:48 Another one of them calls an API, which takes half a second to return.
35:52 You run that in a tracing profiler.
35:54 The one that calls the API is barely changed.
35:57 It's tracing one call, sort of, right?
35:59 You do the other one.
36:00 It's now a million plus little intercepts of like a function call over and over and over.
36:05 And it makes that one that's chatty in Python seem really, really slow.
36:10 By observing it, you've changed it.
36:12 You know what I mean?
36:12 Yeah, yeah, yeah.
36:13 In this sense.
36:15 I'm very sad to report that, unfortunately, because you're talking to a physicist,
36:19 I'm going to be a pain here.
36:21 Do it. Let's do it. Let's get it right.
36:22 I'm going to put my pedantic hat here.
36:27 So, yes, you're right.
36:28 Also, technically speaking, it's not really correct.
36:33 The reason is because, yes, that is indeed what happens in quantum mechanics.
36:36 When you observe, you modify the system.
36:38 That is correct. That part is correct.
36:39 But the reason the metaphor kind of like doesn't fully work is because the important part of quantum mechanics
36:44 is that before, if this was quantum mechanics, before you actually measure your program,
36:50 your program is both fast and slow at the same time.
36:52 But that's the key, right?
36:55 We got the cat in the box as the profiler now.
36:58 Yeah, right, right.
36:59 Here, the profiler, sorry, your program was the cat.
37:02 So your cat is dead, right?
37:04 And then you say, well, you know, I can move the box and then suddenly, you know,
37:11 I open the box and it's dead, right?
37:13 So you say, well, you modify the system.
37:15 But here, you know, for being quantum mechanics, you, I mean, it would be a very good excuse
37:20 to tell your boss and then say, no, no, no, you don't understand.
37:23 This program is fast and slow at the same time.
37:25 If we measure, we would screw it up, you know?
37:28 So like, we must not measure the program.
37:31 Well, here, of course, you can imagine that what happens here is that the program is either
37:35 fast or slow.
37:36 And what happens is that when you measure, you are making it much slower.
37:40 So, but it was already fast or slow.
37:42 It's just you're making it worse.
37:44 So it was slow, now it's very slow.
37:46 And if it's less fast, now it's slow.
37:48 But it's not like, oh, wow, it was in this superposition of states.
37:52 I know I'm not a fan person, so don't feel too bad.
37:56 It's still a good metaphor.
37:58 My warning is that the tracing profilers make it unevenly slower.
38:04 Some parts get away.
38:06 Like parts that do a lot of internal in Python function calls are affected a lot.
38:11 stuff that works with external systems that don't require much execution of python but themselves
38:16 are slow are not very affected by tracing profilers that was my warning my my quantum mechanics
38:23 analogy wasn't perfect i understand so let's try this sorry sorry sorry no what about string theory
38:28 no no i'm just kidding let's let's talk about let's talk about the peps let's talk about what's
38:34 coming here.
38:36 Oh, right, right.
38:37 And we got the PEP 799, a dedicated profiling package for organizing Python profiling tools by the two of you.
38:45 Awesome.
38:45 Tell us about this.
38:46 And then we're going to talk about 768, which is some of the actual changes.
38:52 Yeah.
38:52 So how did we start the back story, Pablo, that I think we actually were planning
38:56 to put the something profiler in the profile package, right?
39:00 I think that was the original conning plan.
39:02 And then it turned out we cannot do that.
39:06 And that led to this path.
39:08 Because basically, let's do the right thing, right?
39:10 Let's clean up this.
39:12 I don't want to say mess, but let's clean things up.
39:14 And that would mean that you're going to have a single tracing profiler.
39:19 Eventually, we can talk about how that's going to go.
39:20 And then you're going to have one sampling profiler.
39:22 And this is all going to be grouped into the profiling package, which should provide much better sort of ergonomics.
39:28 It should make it much easier for developers to decide what tool they should reach for.
39:32 And it also means that there are not going to be two different tracing profilers,
39:36 which makes it difficult to, again, like to choose the right thing.
39:39 So profiling the tracing effectively becomes, that's basically C-profile.
39:45 And C-profile is going to continue living on as the C-profile import as well for compatibility.
39:51 But profile, so that the old Python-only version is effectively deprecated and will be removed eventually.
39:59 And then profiling with sampling is the new profiler, Tachium.
40:02 It makes it super obvious.
40:03 You just import profiling.tracing or profiling.sampling.
40:08 If you understand the nomenclature of profiling, it tells you exactly what you're getting, right?
40:11 Yeah, it gets a bit long with time, right?
40:14 Because like you mostly, as we will discuss, mostly all the time you want profiling.sampling.
40:19 So now it's like, damn, profiling.sampling.
40:23 Like, this is very, very boring.
40:25 But, you know, I propose to just call it Tachium.
40:28 Like, you know, maybe in 3.16, I can convince people to let me have a top level binary name.
40:35 You know, the same way when you install Python in a VAMF, you get, so you can get Tachyon.
40:41 Like, we'll see, we'll see.
40:43 Maybe you should, sorry, maybe you should propose to have a C-Tachyon and a Tachyon module.
40:49 Confuse everyone.
40:50 Oh, C-Tachyon.
40:51 But Tachyon is C already.
40:53 And then just make a compromise to have just Tachyon, right?
40:56 No, no, no.
40:57 Because Tachyon is C, then it will be P-Python in Python.
41:00 Like a pure Python implementation of Tachyon.
41:02 P-Python.
41:04 I've got a fix for you, Pablo.
41:06 Just create a Python package called Tachyon.
41:09 Oh, already exists, man.
41:10 And then all it does is import profiling, tracing, or sampling as Tachyon.
41:18 But apparently we cannot.
41:18 And then you'll be exit.
41:20 Yeah, you're good to go.
41:21 Okay, or I can bribe Charlie Marsh that they add UB-Tachyon.
41:27 You know, like uv profile.
41:29 uv profile?
41:30 How many megadollars, how many megadollars are needed for this?
41:35 Like, we will see.
41:36 Open AI.
41:37 Sam Alman.
41:38 Make it happen, yes.
41:39 Allow this to happen.
41:40 Yes, yes.
41:41 You will be so much popular on the Anthropics, those guys.
41:44 You just need a little prompt injection.
41:45 You'll be good to go.
41:46 Yes, exactly, exactly.
41:47 All right, so, Oslo, you mentioned the old Python profile module is under deprecation warning.
41:56 And that will be in 15 and 16.
41:59 And actually two years from now, two years from now, plus a month, it will be out.
42:03 It will be removed in 317.
42:05 So just heads up for people.
42:07 Obliterated.
42:08 That's right.
42:08 It will be recated into history for real.
42:11 Oblivion.
42:12 Oblivion.
42:12 Okay.
42:13 So this is really just kind of an organizational deal, right?
42:16 This PEP.
42:17 Okay.
42:17 And then we have PEP 768, which sort of makes this possible, right?
42:22 It makes Tachyon, the new profiler, accessible, right?
42:26 Yes.
42:26 So the original of that PEP was to, that's the previous work we did with my colleagues from Bloomberg,
42:33 Ivana and Matt.
42:34 And the idea here is that we were chasing this goal, like North Star, of allowing PDB, the Python debugger,
42:41 and technically any other debugger, but also the one that we ship in the standard library.
42:45 So we wanted that to be able to attach to their programs.
42:48 So you could have a program running in production that is doing weird stuff.
42:51 And instead of having to stop it and then running under the debugger, you could just say, hey,
42:57 you know, touch to that program and like, tell me what's wrong, right?
43:00 So we wanted that.
43:01 And then we added, therefore, to achieve this, we added all these capabilities to CPython
43:07 such that you could attach to a running process and then you could inspect the running process, right?
43:10 Because the debugger needs to inspect the running process.
43:12 So we have all this machinery there.
43:15 And, you know, that was this PEP and that's shipping 3.14.
43:19 And 3.14 has a bunch of utilities that use this machinery and allow you to attach with PDV and much more,
43:25 right?
43:26 But then we were at PyCon US 2025, and then I went to Laszlo, and then I told Laszlo,
43:32 hey, Laszlo, would it be cool to call this in a loop?
43:35 And then we have a profiler, and then Laszlo is like, yes, let's just do it.
43:40 So in the sprint, we did this mini program that was calling this thing in a loop,
43:45 right?
43:46 So this thing allows you to get the stack of the application, kind of, and then at the end,
43:50 the profiler is just doing it very quickly and dump the information somewhere.
43:55 But that is at the point not important.
43:57 The most important part is how fast can you see what the program is doing, right?
44:01 That's what a sampling profiler does.
44:03 And just for reference, because many people may not be aware of these tools,
44:09 the minimum, minimum, minimum number that you are looking at may be something like 100 times per second,
44:15 right?
44:15 That would be on the realm of useful already.
44:18 And it goes from there to more than that, right?
44:21 So we put the loop and then we measure, okay, how fast is this loop here?
44:27 And it was like two times per second, like two times per second.
44:31 That was how fast it was, which as you can imagine is not fantastic, not fantastic.
44:36 So we sat down together and for the course of the sprint, we basically moved from two times per second to an illegal number,
44:47 like a month of frames per second, which I think even today is more than a million times per second.
44:53 But yeah, how was your experience during that time, Lasslo?
44:56 Well, yeah, I remember that we were chatting about this in the beginning of the sprints
45:00 and Pablo laid out the plan.
45:02 This is what we're going to do.
45:04 I'm going to figure out how fast this thing is and then I will see if I can make it faster
45:08 because it might not be that good yet.
45:11 And you're going to work on building UI around this, the CLI, right?
45:15 Like, let's build up all the machinery.
45:18 And then we sat down and probably just said, hey, this thing is so very slow.
45:22 This is, like, not useful.
45:23 And then we literally spent the entire rest of the sprint working on that.
45:26 I think we actually ended up with no code committed, I think, during the sprint.
45:31 All of the actual commits went in later on.
45:35 But the sort of going through these motions of, like, basically every single change, getting a 10x.
45:42 I mean, initially, it was easy to get a 10x improvement when you have like two hertz,
45:47 two samples a second, right?
45:49 But then just making it faster and faster.
45:51 And actually I remember that even after that, Pablo made a couple of improvements later on
45:57 and maybe we can go into details later, but he made a couple of improvements
46:00 which really just made it.
46:02 It was already, I think around 200,000, maybe 100,000, 200,000 hertz at the end of that on the sprints
46:08 and then still like a 4X, 5X improvement later on.
46:12 So I think That's crazy.
46:13 Yeah, and I think it was a headline later on.
46:16 It's the fastest sampling profiler, basically.
46:21 Yeah, just to be clear also, I think it's a good moment to mention this.
46:25 This is not the first sampling profiler of this kind there is by far, right?
46:29 There is a couple of them.
46:32 There's quite a lot of tooling in this space.
46:34 Perhaps the most famous existing tooling there is another profiler called Pyospy,
46:39 which has been for a while.
46:42 and it's a very good piece of software.
46:45 It's written in Rust.
46:46 And this is quite efficient.
46:49 The thing, so you may ask, okay, why to have one in the standard library,
46:54 right?
46:54 So the answer to that is that, first of all, unfortunately, PySpy and any other provider of this kind,
47:01 because it doesn't run inside your application, the trade-off is that it needs to learn
47:05 how to analyze your application, right?
47:07 And that is understanding the Python interpreter.
47:10 But these parts of the Python interpreter are not public, right?
47:13 Like we don't expose that.
47:14 It needs to illegally access to them.
47:17 And that means that there is a competing set of circumstances here because the core developers,
47:23 first of all, we used to not care about this use case because it was not part of our APIs.
47:29 So we keep changing things in ways that make it really, really hard for Biospy and other profiles like Austin to catch up with this.
47:35 To the point that, for instance, it used to be the case that profiling 3.11 was much slower than profiling 3.10
47:41 because 3.11 made changes that make this really, really hard.
47:45 And sometimes, I was keeping an eye to help these tools, but sometimes people were making changes
47:50 that were making it impossible to profile because it was hiding this so much
47:54 that you couldn't have access to it.
47:56 So one advantage to have this on the standard library, of course, is that now this is something that we offer.
48:03 And this profile is also like the reference implementation of such a profiler.
48:08 So if we can do it, then anyone can do it, right?
48:10 So that we ensure that this is a feature that Python offers and will never break.
48:15 And if you want to, you know, make your profiler externally, then you just need to reimplement what we do,
48:21 right?
48:21 And then you always have a way.
48:22 You can look at how we do it and then you can do it as well.
48:25 So that is very important.
48:26 The second part is that, you know, as many, there's many examples and this is a very delicate aspect of it,
48:32 is that having this tool in the standard library, we consider now that this was like very important to have it in the set of like batteries included
48:39 right because you know you need to like learn for a external tool like is that external tool going to
48:44 be as with the quality that we expect and is going to like have all the edge cases that can have so
48:50 because we are dealing with internal soft cpython we don't know in real time all the little
48:55 intricacies intricacies of like handling these problems so we want to share that the tools
49:00 that we offer are of the utmost quality that we can provide, right?
49:04 Which is to say that it's not that we don't trust the others, right?
49:07 But we want to ensure that users at least have a very good reason to use something that is built in.
49:15 And then the third reason, which is piggybacking on what Laszlo was saying,
49:20 is that at some point, we managed to achieve the same speed as any other tool outside,
49:26 including PySpy and Austin, right?
49:27 But then because we have an extra trick that they don't have, which is that we also control the interpreter,
49:33 right?
49:33 Because this is now in CPython.
49:34 So now we could do changes to the interpreter with the only purpose to ensure the profiling is faster,
49:40 right?
49:40 And also, by the way, this means that anyone can also do that, right?
49:43 So now anyone, like those other profilers can also, you know, now we say that this is the faster Python profiler,
49:49 but, you know, I'm pretty sure this is not going to be for long.
49:52 Spoilers in a second.
49:53 but like part of the reason is because anyone can use the tricks is but it's just like we did
49:58 you know we can ensure that those tricks work and those tricks are there so part of the reason we
50:02 could go past what was possible before is because we can cheat a bit and we can like change the
50:06 interpreter such that like it exposes easier information and some of those tricks are really
50:11 really cool and complicated like the way you know it can go faster is really interesting
50:18 perhaps i don't know if we can explain it here but like uh they're quite advanced but like anyone
50:23 can pull those tricks if they know how it works, right?
50:25 It's just that they need to ensure that they implement those things.
50:29 Yeah, very interesting.
50:31 I don't know if we actually called out the title, but PEP768 is a safe external bugger interface for CPython.
50:38 And debugger means like, hey, what are you doing?
50:41 But that's also kind of a profiling thing of your only purpose just to say, what are you doing?
50:45 Where are you?
50:45 Where are you?
50:46 Where are you?
50:46 Like over and over a million times a second, whatever frequency you want to run at, right?
50:50 Right.
50:51 There's another interesting aspect where a built-in sampling profiler in CPython is super useful,
50:57 which is that, and I ran into this myself as well, that when you're working on CPython itself,
51:02 you don't have a profiler which you can use to measure performance.
51:05 Because typically the third-party profilers will, when you're in an alpha phase of the changes,
51:12 typically those profilers wouldn't support that version of CPython.
51:17 Now you will have a something profiler which works, which is within NCPython itself.
51:23 I run into this working on the profiler itself.
51:27 How do you measure the performance of the profiling code, like all of those Python,
51:34 fairly complex Python code?
51:37 You can't really do that without having a profiler built in.
51:41 So that's another nice effect of having a something profile built into the standard library itself.
51:47 Yeah. And as Pablo said, you can optimize for it so that now that you have a stable interface,
51:51 we can say, okay, this is the thing we're going to optimize with everyone else just randomly
51:55 poking around the bytes and my code and all that kind of stuff.
51:58 It's like, well, you still need to poke around the bytes on the bytecode. It's just like,
52:01 at least now, you know, it's possible.
52:03 You know, you can follow the trail, you can follow the soldiers of giants kind of thing, you know?
52:08 Yeah, exactly.
52:10 Exactly.
52:11 It is interesting.
52:12 You could use it to figure out how stuff runs on the newer versions, because even though maybe the shape of stuff has changed,
52:17 it's still the same API.
52:18 Oh, actually, yeah.
52:21 And also just to clarify another thing, like right now, which is also important and it's also an advantage of the other profilers is that, of course,
52:29 this is using this extra technology that we added to 3.15, which means that it only runs in 3.15.
52:34 So you can only analyze 3.15 code from 3.15, while PySpy works with any Python.
52:41 So right now you want to run PiSpy on 3.12, you can.
52:45 Or 3.13 or 3.14.
52:47 You know, with different performance characteristics for sure, but you can
52:51 do that.
52:52 Or Austin or whatever of the other ones, right?
52:55 But right now, this one only works from 3.15 forward, right?
52:59 And between the same version.
53:01 So that's an important thing.
53:03 It's not a limitation for the future.
53:05 It's possible that we can allow 3.15 to analyze forward.
53:09 Sorry, backward for 3.15, so 3.16 can 3.15 and 3.16 or 3.17 can do 3.15, 3.16
53:17 and 3.17 but still we don't know. We don't know if we want to get into that
53:24 but yeah, that's another advantage but if you go to the I don't know if you,
53:28 I can see that Hold on really quick before we move on what about this Python backport
53:33 stuff?
53:34 Are you familiar with this?
53:35 Python profiling?
53:36 Backporting the new profiling library to, I don't know what version goes
53:40 to 3.14.
53:41 Like a Clanker made version of this, like, or something like a version?
53:45 Let's see.
53:47 Yeah, possibly it was made over a one-week period.
53:50 So, yeah, probably.
53:51 Yeah.
53:52 Well, I mean, it is possible because, technically speaking, you can, like, you go up in this repo.
53:59 We are looking at the GitHub repo.
54:01 So, you go up in this page.
54:03 You can see that there's this underscore remote debugging.
54:05 So, that is the C-Python folder, right?
54:08 So probably what happened here is that they copy this code and they strip all the new cool,
54:13 you know, bells and whistles for 3.15.
54:16 And that still works very well for 3.14.
54:19 I don't know if it works for less.
54:21 So I will be interested.
54:22 Can you check the Python version, perhaps, in the set of py or something?
54:25 Yeah, sure.
54:26 Py project.
54:27 Oh, they will set py.
54:28 Wow, how about that?
54:29 Okay.
54:30 Yeah, okay.
54:31 Well, interesting.
54:32 Yeah, 3.14, you see?
54:34 So, yeah, it supports 3.14 only because, you know, It's the 3.0 version minus the cool things.
54:39 So it's still using the debugging interface.
54:43 You can see the bag obsessed validation.h, which is clearly the bag stuff.
54:49 So that is possible.
54:51 Unfortunately, as you really well know, we cannot backport features in CPython.
54:55 So this is good.
54:56 This is good.
54:57 I mean, I'm happy people are doing this.
54:59 So maybe it gives you a little bit of a lever of today and tomorrow.
55:02 Yeah, and this makes me happy, right?
55:06 Like, look, man, if people are willing to like pull tricks to use our stuff in all versions,
55:12 like amazing.
55:13 You know what I mean?
55:13 Like that's success to me.
55:15 What's worse is they don't care and they don't pay any attention.
55:17 They just leave it, right?
55:19 Yeah, yeah.
55:19 Well, you know, who the bugs are going to go to?
55:22 Like that's an interesting question.
55:23 But like, you know, if you report a 3.14 bug in Cpython, I may tell you, hey, man, what
55:28 are you doing?
55:29 But like, you know, if they are willing to bug for the bugs as well, then let's go.
55:34 You know, like that's good to me.
55:36 So I actually did this.
55:38 So I tried doing this.
55:39 This is not my project, of course, but I tried this because this seemed like a good idea.
55:45 Hey, how can we make this work in 3.14?
55:47 And that was the idea.
55:48 You can just literally take the profiling package and just copy that over.
55:53 But it's not that simple.
55:54 So there are some changes in internal CPython structures in CLO.
56:03 It's not a lot of changes, but you do get some changes there.
56:06 You may be able to get away without those, but the patch is enormous.
56:10 It's absolutely gigantic.
56:11 I did not realize how much code there is in Tachyon until I was doing this.
56:16 And that just means that every single patch version, every single change,
56:18 you will have to maintain this.
56:20 There may be significant maintenance.
56:22 So the idea was rejected, sort of fact, to do this and maintain it as a separate package,
56:28 at least for me.
56:29 I don't see this as a long-term, this back thing as a long-term useful thing,
56:33 but maybe in the first year, you know, as people are searching for 3.15.
56:37 Of course, of course, yeah.
56:39 And then in three years, you tell them, like, what are you doing 3.14?
56:41 Get out of here.
56:42 But, but, but, but, ooh, maybe we can talk about this later.
56:46 But like, one interesting thing, well, actually, let me segue into it smoothly,
56:51 smoothly.
56:51 Let's do some smooth segue into it.
56:54 So one interesting thing that is also important to mention, And I can see that you have the profiling.sampling documentation in the sidebar.
57:02 So let's open that for the people viewing this in YouTube or whatever.
57:06 So the documentation here is huge, huge, huge documentation.
57:10 Why is that?
57:11 Because this does a lot of things.
57:12 It does a lot of things, a lot of things, by the way, that only profiler can do.
57:16 So it's not just about being fast.
57:17 It does all sorts of other things.
57:20 So as opposed to like cprofile that like has like, you know, the PSTAT format
57:25 and can tell you like basic, you know, statistics about your program or whatever.
57:29 Like this thing is a full beast.
57:32 It comes with everything, right?
57:33 So here Tachyon can create like, like flame graphs.
57:37 It can create all sorts of visualizations.
57:39 Like, so it has that top model.
57:41 So like, like when you do top and you see the processes life.
57:44 So Tachyon has this like, like Tachyon life.
57:47 Well, I can show you like the functions life of your application, like almost like a top,
57:51 it can create like heat maps.
57:53 So you can see lines with different colors depending if they are more hot or cold, if they are more slow or fast.
58:01 You can do differential frame graphs, which is very cool.
58:05 You can run your program and then change a bit and run it again and then compare what became faster and slower.
58:13 So it can tell you what functions were faster and what functions got slower.
58:17 Another very cool thing that this does is that it does async audio, which is the first
58:21 profiler right now that like can also do async audio because like, you know,
58:26 the even loop does all sorts of weird things.
58:28 Right.
58:29 And it's often one thread, basically kind of async call stack.
58:32 So it's like, what are you doing?
58:33 Like, well, we're dispatching.
58:35 Yeah, exactly.
58:35 Exactly.
58:36 What is that?
58:36 What is that?
58:37 Exactly.
58:37 Yeah.
58:38 Or like, you know, it's like, oh, you know, but it's also important because I think
58:42 I do changes a bit the, what means slow or fast.
58:45 Like, for example, imagine that you're downloading a 3GB file, but the server is slow.
58:52 So you're spending a lot of time waiting for that 3GB file, not because you are crunching
58:57 your CPU, it's because your server is slow.
58:59 But your application is slow because the server is slow.
59:02 So how do you know that that is happening?
59:04 Well, in the normal world, if that was the case, you would be like, I don't know, reading
59:09 or something.
59:10 Like, you will see that the profile will show you that you are reading, reading, reading,
59:13 so you can't imagine what's going on.
59:15 But in this case, because the event loop will only be waking up when the server has something to tell you.
59:20 Meanwhile, that will never appear.
59:22 So like if you can only see the coroutines that are running, the fact that you are waiting for the server to send your data will never appear in your flame graph because it's not happening.
59:30 So you will never know that what is slow about your program is that your program is waiting for a three-hour file to appear,
59:37 right?
59:37 Yeah, this is especially important for a sampling profiler, right?
59:41 Exactly, exactly, because you are not tracing it.
59:43 Also tracing in the even loop is very weird because you keep changing for task to task, so it's very confusing.
59:49 But here in Taki has these two modes.
59:52 One of them is like tasks that are running.
59:55 So you can see only running tasks.
59:56 So in that case, for instance, if you're waiting for the 3D guy file, it will not appear.
01:00:00 But you can see that meanwhile you're doing other things.
01:00:02 But also it has this mode, which is all the tasks that I'm waiting for.
01:00:06 So every time you sample, you see every single task that is going on.
01:00:10 So you can see that like, oh, I'm waiting for this 3G file.
01:00:14 It's just that it's not advancing.
01:00:15 So because it's not advancing, it will appear in more samples.
01:00:18 And then you will know that like that guy is like all the time being waiting for.
01:00:22 So like, you know that it's happening.
01:00:24 And then apart from that, it also has like dump mode when you can have like,
01:00:28 you know, imagine that your application is frozen because you have a deadlock or perhaps,
01:00:32 you know, you know, it's just waiting for IO that never arrives and you want to know where it's going.
01:00:37 so you can use profiling.sampling dump and then you pass the PID of your application
01:00:43 and then it will show you what's going on.
01:00:46 It will show you the stack trace.
01:00:47 Imagine the stack trace, like if an exception is thrown, but instead of throwing an exception,
01:00:51 it will show you where it is.
01:00:53 And of course, this works on everywhere.
01:00:55 So it works on macOS, it works on Windows, it works on Linux.
01:00:58 Same mechanism, same guarantees, same everything.
01:01:02 Okay, that's awesome.
01:01:03 Now, you threw out a bunch of stuff there And I think it's amazing how much is here,
01:01:07 but let's just go back really quick and just, let's just focus on this.
01:01:11 I think this is, this kind of game changing.
01:01:12 Yeah, there is so much.
01:01:13 There is, you need a second podcast, man.
01:01:15 Like you need to invite us a second time.
01:01:17 What do we even do?
01:01:17 Like we got to just, we're going to go, we're going to go, keep going.
01:01:20 So the attach, this is, there's something running in production.
01:01:24 Let me, right now it's doing whatever it is that we're like, what is this doing?
01:01:28 What's going on?
01:01:29 How do we fix this?
01:01:29 Or just what's going on?
01:01:30 you can attach to it, grab a pstat file, take that away and work on it, right?
01:01:36 Without, I mean, it probably does affect the performance somehow, but not nearly the same.
01:01:42 No, no, it's free.
01:01:43 It's free.
01:01:43 It's free.
01:01:44 Okay.
01:01:45 It's free.
01:01:45 The key way it's free is because, well, okay, sorry.
01:01:48 It's free by default.
01:01:49 There is something that you can do.
01:01:51 We can't go into detail in a second, but there's something that you can do to kind of like have more exact data
01:01:58 that will slow it down a bit.
01:02:00 But still, for most of the sampling rates, it's mostly free.
01:02:03 So by default, Acheon will never stop your application.
01:02:07 It will just always read what is going on.
01:02:09 Of course, the trade-off is that you can do partial reads.
01:02:12 So perhaps it's reading, a structure that's changing, so it gets some weird stuff.
01:02:17 So Acheon, most of the time, will detect that that is happening and it will throw away the sample.
01:02:21 So it will say, okay, this is a bad sample.
01:02:23 And it will not read it.
01:02:24 But of course, that means that you have less samples if that is happening a lot.
01:02:27 That can happen, for example, you have a lot of generators, because generators tend to be a bit like,
01:02:32 you know, you get partial reads.
01:02:34 So sometimes it happens.
01:02:35 But by default, it will only read from the application.
01:02:38 And the application, first of all, the application doesn't know that this is happening.
01:02:41 And, you know, unless you only have one CPU and then you are giving the CPU to both programs,
01:02:45 which in today's computers, that will never happen.
01:02:49 I don't know, you're running a Docker container with only one CPU core or whatever.
01:02:53 but like, you know, you run the profile in another, you know, sidecar or whatever, like that would ever happen.
01:02:58 So unless that's the case, like the application will never know and it will run at full speed.
01:03:02 If you want to avoid this kind of partial read situation and you want to show that every read is consistent
01:03:08 and increase the kind of like exactness and, you know, trustworthiness of the data,
01:03:14 then there is this mode where you can pass does this blocking.
01:03:17 And what does this blocking will do is that before reading, it will stop the application for a split millisecond,
01:03:22 very quickly, it will do the read and it will restart it.
01:03:25 So, of course, if you do the default sampling rate or even sampling rates up to 10,000 Hz,
01:03:31 that is a very small amount of time.
01:03:33 We are talking about slowdowns of 1% to 2%.
01:03:36 So 1% to 2%, not two times.
01:03:38 It's 1% to 2%. It's nothing.
01:03:40 If you've done profiling before, it's much, much lower.
01:03:43 It's like, whatever, man.
01:03:45 What are you talking about?
01:03:48 We would make Parthons 315 5% faster, and then that's fine, right?
01:03:52 But like if you ramp the sample rate really high, like let's say 100,000 samples per second,
01:03:59 then we are talking about like more, like 20% or 30% or 80%.
01:04:02 I think that you do it at crazy rates, like 1 million samples, if your machine can do it,
01:04:07 because now it depends on your machine to be able to do that.
01:04:11 Then we are talking about two times lower or something like that.
01:04:14 But like you see, like you need to like go really, really crazy.
01:04:17 So in production, for example, you can sample perfectly at 100 or 1000 hertz and have a slow
01:04:23 dance of one or two percent.
01:04:24 And it's fine. It's acceptable.
01:04:27 And this thing that we're talking about, this thing is so important.
01:04:31 You don't understand how important this is. Like I'm free to say this is not a trade secret.
01:04:35 Like my employer used this thing all the fucking time for making a lot of money.
01:04:40 So you cannot imagine how critical it is to understand why your programs
01:04:45 like are slow or how your programs can be optimized.
01:04:49 Because a lot of the time you just need to see live traffic.
01:04:52 Like if you have or like live data, right?
01:04:54 If you never know how your application is really going to behave or what is slow
01:04:58 until you measure the real deal.
01:05:00 You cannot measure the fake deal.
01:05:02 Like you need to measure the real deal.
01:05:04 And for that, you need to attach because most of the times you don't have access to,
01:05:08 oh, I just want to launch my application on the lab profiler.
01:05:10 No, you need to like, you just have it there and it's doing something weird.
01:05:14 And then you attach and then you look a bit.
01:05:15 and then you detach, right?
01:05:16 Even this, let's say for example, that blocking was 50% slowdown.
01:05:22 You could do it for like a bunch of seconds and then detach and you know,
01:05:25 here is all good.
01:05:26 And then you got the information and then you can reason about it.
01:05:29 And then you can manage - That information is so good, Pablo.
01:05:32 The in -production information is so much different.
01:05:34 It's key, it's key, it's key.
01:05:36 Like for this year, I mean, this is kind of the segue and the secret and whatever,
01:05:40 but like one of the things I've been working on here, had solar training for like this past year is precisely all about getting,
01:05:49 well, not all about, but like, like, but a lot of my work here has been to ensure that getting that information and much
01:05:55 more from light data is what you do.
01:05:57 And we can go into why it's insane here. But like, part of the reason is because this information is gold,
01:06:04 like, it's just the best thing that you can do, because it's telling you literally what you need to change.
01:06:09 It's almost cheating.
01:06:10 You know what I mean?
01:06:14 You bad change this thing and then you go and like literally today today right we activated a mega
01:06:21 version of this which is not tacky only something else but we activated a version of this at work
01:06:26 in one of the machines that the data scientists used to like the supercomputers that we have here
01:06:30 so here we have a lot of supercomputers and then like people do their their you know the experiments
01:06:35 or things with trading and you know that's like i don't know it's war like it's huge machines
01:06:41 like hundreds and hundreds of gigabytes of memory, like hundreds of cores.
01:06:45 So it's like war, right?
01:06:47 And then for the first time, because this is so ridiculously complicated
01:06:50 and these machines are so big that like it's so different to do this thing at scale,
01:06:54 we managed to have a version of this that is tracing all programs.
01:06:57 So not just one, all of them, right?
01:06:59 And using this live data, literally today, we saw one of these applications that was doing something slightly odd.
01:07:06 It's like, why is this application taking like an entire core of the machine
01:07:10 when it should be doing nothing.
01:07:12 And I was like, hmm.
01:07:13 And we look at that and it turns out that in some specific case that was happening a lot, but nobody thought that this was going to happen,
01:07:20 one of the algorithms was underperforming slightly because it was accidentally quadratic in one way, right?
01:07:27 Which is like, again, it's very difficult to see.
01:07:28 If I show you the code, no person on the planet will see it.
01:07:31 It is so ridiculously complicated to see.
01:07:34 But we could see it as clear as day on the data.
01:07:36 It was so obvious, so obvious, so obvious.
01:07:39 And bam, we remove it and ba-da-boom, we have a core on every single machine of our supercomputer free now.
01:07:45 That's awesome.
01:07:46 This is ridiculous.
01:07:47 You know how this is like a huge amount of money saved.
01:07:51 So getting this data is the best thing that you can do.
01:07:54 Listen, everyone listening to this, just grab this thing, put it to your application and your manager will be happy forever.
01:08:00 Like it's just the easiest way to make your manager happy.
01:08:03 Just go measure the shit and fix the thing and don't tell anyone the trick.
01:08:07 And they're like, damn, you just fix it.
01:08:09 You can do it to other teams.
01:08:11 You're a performance wizard is what you've become.
01:08:13 Look at you.
01:08:14 Exactly, exactly.
01:08:14 Just attach it to other people's programs.
01:08:17 And then you see what's low.
01:08:18 And suddenly you have a change in their code.
01:08:20 And they say, wow, how did you do?
01:08:22 And like, damn.
01:08:24 Incredible.
01:08:25 Just do it before everyone knows how to do it.
01:08:28 What the secret is.
01:08:28 No, like you knew from this podcast.
01:08:31 You knew it because you're here.
01:08:32 Don't worry, I'll delete the episode really soon.
01:08:35 Oh, damn, damn.
01:08:36 That way the secret will be safe.
01:08:38 No.
01:08:39 Yes.
01:08:41 And this is just part of Python.
01:08:42 It's just free stuff.
01:08:43 I mean, the stuff that you're doing, the multi was obviously extending this,
01:08:47 but this just comes with Python 3.15, right?
01:08:49 Yes, this comes with Python 3.15.
01:08:51 Sorry.
01:08:52 I think it's really important to emphasize how, what a superpower this is,
01:08:57 because I think in my experience, even if you have some tooling available
01:09:02 for this sort of production profiling, it's not always the case that you have access
01:09:06 that in the worst possible time when things are blowing up and you need something like that.
01:09:12 It's the opposite.
01:09:13 You don't have these tools ready when you realize that you need it, right?
01:09:17 And what's amazing about this is that all you need is to have 3.15 installed
01:09:20 and running in your application.
01:09:22 And this opens up all sorts of possibilities.
01:09:24 Like you can just go there and grab, you know, when things are happening,
01:09:29 you can go there and sort of grab some sort of profile out of that.
01:09:33 But I think it also opens up a lot of possibilities for the future.
01:09:37 I mean, you can even implement continuous profiling with this thing if you wanted to,
01:09:42 where you do this as a long-term thing on a lower sort of sampling frequency.
01:09:47 But I think it's also important to emphasize here that Tachyon is not just a production profiler.
01:09:52 So it has several modes where you attach to your process, to your live process,
01:09:56 and that's super powerful and that's useful in many cases.
01:09:59 But you can also load up your sort of application.
01:10:02 It has a mode where you can just load up an application and then you start profiling as the program starts
01:10:08 and it finishes at some duration and then you look at that data.
01:10:12 So this is also very useful potentially in your development environment.
01:10:16 Different reporters which are designed for development sort of processes,
01:10:21 for example, you're looking for, you want to compare two different profiling snapshots.
01:10:27 You know, like you make code changes and you want to compare how well those changes are,
01:10:32 how much faster, how much slower are making your application.
01:10:35 So I definitely wouldn't sort of lock it back in and like, you use this when you have performance issues in production.
01:10:42 You can use it absolutely for any sort of profiling situation.
01:10:46 Yeah, like a CLI sort of situation like you're talking about, maybe.
01:10:49 Exactly.
01:10:50 So you can use it actually we have the run here on the screen. So you can run a script or you can import
01:10:57 a module with it and then you basically go from there.
01:10:59 And there you can have, that can be your test suite or it can be a sample
01:11:03 thing or it can be a CLI which you're looking at sort of improving the performance.
01:11:08 By the way, since you were talking about quantum mechanics before.
01:11:11 We're on the string theory now.
01:11:12 No, just kidding.
01:11:13 Go ahead.
01:11:13 Yeah.
01:11:14 No, no.
01:11:14 Well, well, well, well, well, well, well, well.
01:11:16 We're in relativity now.
01:11:17 Do you know why it's called tachyon?
01:11:19 I was wondering, but I haven't asked yet.
01:11:20 No, why?
01:11:21 I don't know.
01:11:22 So a tachyon is the name of hypothetical particles that go faster than light.
01:11:27 So like a photon is a particle that goes at the speed of light because, you know, it's
01:11:31 the particles that made up light.
01:11:33 So, you know, that's a photon.
01:11:35 And, you know, special relativity doesn't say that this is not possible.
01:11:39 It just says, like, if you're a photon, you cannot go faster than the speed of light or slower than the speed of light because you are light.
01:11:45 And if you are, you know, you have mass, like a normal thing, you cannot go faster than the speed of light or at the speed of light.
01:11:51 So the speed of light is like a limit, but you can also don't achieve it.
01:11:54 But then special relativity also says, well, you could also be faster than the speed of light.
01:11:59 And what happens if that is true, you cannot go at or lower than the speed of light.
01:12:03 And of course, we have not seen such a thing.
01:12:05 So that is very likely not true because among other things, tachyons will travel back in time,
01:12:11 which is like perhaps a bit crazy.
01:12:12 But in theory, you know, we have to talk about those possibilities and to investigate them.
01:12:18 So we have to name them.
01:12:19 And then the name for those particles is called tachyons, which is tachy, which is fast in Greek.
01:12:25 So that's where it comes from.
01:12:28 That's awesome. And it has its own logo as well.
01:12:31 Oh yeah, Mike Jimenez did that.
01:12:33 So Mike has been the person who has done some of the logos for the releases.
01:12:37 So she did the 310 and 311.
01:12:40 She's an ML researcher at World DeepMind.
01:12:44 And she's also a very good artist.
01:12:47 And she does a bunch of these logos.
01:12:49 So she created the Tachyon logo.
01:12:50 Very cool.
01:12:51 I do want to say one more thing about the attach.
01:12:54 Something that has always bothered me about profiling.
01:12:56 and I've sort of solved it by writing code, like disable the profile or it start
01:13:01 and then enable it for certain things I'm interested in.
01:13:04 But there's just so much overhead about the startup of your app that's just noise,
01:13:09 right?
01:13:09 Like all the imports, all the other, you're like, I don't care about that.
01:13:13 I just want to know once it's up and running, what does this take?
01:13:16 You know what I mean?
01:13:17 And for an app that's sort of up and running for a while, just attach to it,
01:13:22 do the couple of things you're going to do that invoke that and then detach,
01:13:25 gets a really focused view, I would imagine.
01:13:27 Right. Yes, absolutely.
01:13:29 So getting a little bit short on time, but one more thing I want to ask you about,
01:13:34 because there's this profiling mode, which I don't fully understand.
01:13:37 I know you guys can tell me we have wall clock mode, CPU mode, we have GIL mode,
01:13:42 and we have exception mode.
01:13:43 They all sound useful.
01:13:44 But what are these?
01:13:45 What are these?
01:13:46 Yeah, yeah, yeah.
01:13:47 So, you know, okay, interesting.
01:13:50 So the idea here is that, you know, the profiler will look at your application
01:13:55 time to time, I will say like, okay, what's going on?
01:13:58 And it will basically take notes of what application is doing, right? So that's the basics.
01:14:03 Okay, so these modes are basically filters or the samples.
01:14:06 The reason is the following.
01:14:07 Imagine that this is very common. Okay, I will tell you an actual case that happened here, right?
01:14:12 So let's say you have two threads.
01:14:15 Let's say one of those threads is waiting for the network.
01:14:18 So it's blocking on select or listen or whatever, right?
01:14:21 And then the other thread is doing, I don't know, calculations or whatever it is,
01:14:26 right?
01:14:26 And then you profile those threads.
01:14:28 And then if you can look individually at every thread, but if you look at the whole thing
01:14:32 together, it will tell you, okay, half of the time you're spending listening on the
01:14:35 network and half of the time you're calculating pi, right?
01:14:38 So in this case, the network is noise.
01:14:41 I don't care about that because I cannot improve the network.
01:14:44 You know what I mean?
01:14:45 I cannot just make it fast.
01:14:46 Or let's say I'm sleeping.
01:14:47 I call sleep, sleep five.
01:14:49 then the provider will correctly tell you, you are waiting five seconds on Sleep 5.
01:14:53 But like, okay, but that's not very useful.
01:14:55 You know what I mean?
01:14:56 Like that, I cannot fix that, right?
01:14:57 As part of the, and that can be written in a file or like, you know, IO in general.
01:15:02 So, but that is through the steel, right?
01:15:04 Because if you wait five seconds, your program will take five seconds.
01:15:06 So if you want to know why is my program waiting five seconds, it's because it's sleeping for five seconds.
01:15:11 So that's the correct answer.
01:15:12 It's sometimes it's a good answer, sometimes it's not.
01:15:14 So by default, it will tell you that's called wall clock.
01:15:18 It's called wall clock because if you look at a clock in the wall, it will tell you that your application took five seconds,
01:15:23 right?
01:15:23 Even if it wasn't sleeping.
01:15:25 But of course, sometimes we don't want to look at that.
01:15:27 We want to know when my application is doing something, you know, because here it's just waiting,
01:15:32 right?
01:15:32 Waiting for data, waiting to read disk.
01:15:36 Maybe your disk is slow.
01:15:38 Maybe the network's slow.
01:15:39 Maybe you're sleeping.
01:15:40 So you want to know when your application is doing something.
01:15:43 That is called CPU time.
01:15:44 So it's not time that you will measure.
01:15:46 like how much time is actually your application running in the CPU.
01:15:50 So when you run it in mode CPU, you are filtering all those things that your application is waiting.
01:15:55 So you're filtering all the samples when you're sleeping or waiting for network.
01:16:00 And then you only get the samples when your application is doing something,
01:16:04 which are the ones that you can actually improve, right?
01:16:06 Because like now I can look at a better algorithm or I can look at better module
01:16:10 or, you know, I'm parsing JSON.
01:16:12 So, you know, that both are interesting because for instance, let's say you're parsing JSON,
01:16:17 you need to read the JSON.
01:16:18 And for that, you need to wait for your drive or the network to give you the JSON.
01:16:22 That might be interesting to know that 30% of the whole time is you waiting
01:16:26 for the JSON to be given to you.
01:16:28 So that is all useful information.
01:16:30 Now, once you know that, you cannot improve that because that is, you know,
01:16:34 you tear or the file system, but you can know that you're parsing JSON and that's slow.
01:16:39 So you can say, okay, I can use a better JSON parser, right?
01:16:41 Right, or JSON or RISM rather than built in JSON and see how that works.
01:16:45 Yeah.
01:16:46 Exactly, exactly.
01:16:47 So that is wall and CPU.
01:16:48 And then we have like the most exotic ones, which is like GIL mode.
01:16:52 So GIL mode tells you how much time are you spending on the GIL.
01:16:56 And this is a bit of a different, is a bit of the same idea.
01:17:00 The idea here is that if you have, for instance, some program that is spending time
01:17:05 without the gill, like for example, NumPy, right?
01:17:08 You cannot optimize NumPy because that's a SQL, right?
01:17:11 Like you cannot even see what's going on there normally.
01:17:13 Spoilers in a second.
01:17:14 But like you cannot see inside that because no Python code.
01:17:18 So what happens is that because you, you, you, that thing is running without the
01:17:22 guild, you don't have access to it.
01:17:23 So by default, it will tell you who is calling that code and it will associate
01:17:27 all the time that you're spending in NumPy to a caller.
01:17:29 Right?
01:17:30 So let's say the function calling NumPy is called call NumPy.
01:17:33 So it will tell you that call NumPy is 10 seconds.
01:17:36 Right.
01:17:36 But let's say that for 10 of those, for nine of those seconds, the guild is not
01:17:41 held, of course that is on CPU, so it's doing actual work.
01:17:44 But because the GIL is not held, some other thread could do something, right?
01:17:47 So you may have a situation where you have many threads and then you want to know who
01:17:52 is holding the GIL to know what is preventing other threads to run.
01:17:57 Because if you filter all the samples by only the samples that happen with the gill,
01:18:02 you know that that thing, as long as it's running, nothing else is running,
01:18:06 right?
01:18:06 So that's interesting.
01:18:08 So that's another way to cut.
01:18:09 You may say, well, that sounds very complicated.
01:18:11 Well, it's more complicated than CPU or wall.
01:18:13 is harder to understand.
01:18:15 But if you are, you know, already very deep into the weeds and like you are very advanced,
01:18:20 and this is a bit of, I want to say this very explicitly, like something that we try to do with Tachyon
01:18:25 is that it tries to be useful to a very big range of developers.
01:18:31 Tachyon, if you just want a quick answer, you just want to know what is going on,
01:18:35 just tell me what is wrong.
01:18:36 Like it will give you that.
01:18:37 You don't need to know flame graphs.
01:18:38 You don't need to know, like to read this thing.
01:18:41 It will tell you like, bam, bam, bam.
01:18:42 These are the five functions that are slower.
01:18:44 Bam.
01:18:44 And then you go and look, right?
01:18:45 If you are a bit more advanced, you can start asking for frame graphs or heat maps or,
01:18:50 you know, read a bit of these things.
01:18:52 And if you're really an expert, there is like extremely complicated things that you can ask
01:18:56 this profiler.
01:18:57 Like, for instance, the exception mode is the same thing, but it's asking the question,
01:19:01 how much time I spend handling exceptions?
01:19:03 So like errors, how much error handling is costing me?
01:19:06 Of course, you will say, well, that probably is nothing.
01:19:09 But, you know, if you are already like...
01:19:10 It can be a lot.
01:19:11 Yeah, exactly.
01:19:11 You don't know if you are fine tuning.
01:19:13 And also exceptions are used for much more than exceptions.
01:19:16 For instance, as you very well know, the iterator protocol raises, you know, a stop iteration
01:19:22 as exception control.
01:19:23 So that can be, you know.
01:19:24 And then there is also opcode mode where you can look at individual opcodes.
01:19:28 So there is very complicated questions that you can ask your program.
01:19:32 And in particular, CPU wall exception and GIL are filters over the samples such that you
01:19:39 can like know what is your application exactly doing and what is not doing.
01:19:43 Yeah.
01:19:43 Very interesting.
01:19:44 I mean, it's super simple example of exceptions costing is I'm parsing a CRV,
01:19:48 a CSV, and it's coming in as text.
01:19:51 And I think it's a number.
01:19:51 So we do try this thing.
01:19:54 Excellent.
01:19:55 Well, I guess it's, you know, set it to none, right?
01:19:58 You could regex check that or some, you could do something else instead of an exception in
01:20:02 a tight loop.
01:20:03 Exactly.
01:20:03 You get a big bonus.
01:20:04 Absolutely.
01:20:05 Absolutely.
01:20:06 That's exactly it.
01:20:06 Right.
01:20:07 And there's some modes when you don't filter by it, like there's a secret mode that only runs when you use one of the outputs,
01:20:13 which is Gecko.
01:20:15 So we don't advertise the mode because it only makes sense to this mode,
01:20:18 to this format, which is Gecko.
01:20:20 But it's called All.
01:20:22 And what All does is that it records all the samples, but it kind of like colors the sample with what was going on there.
01:20:29 So if the sample is on CPU, it says CPU.
01:20:31 If it's not.
01:20:32 So in that way, you can see kind of like a bunch of lanes of what every thread was doing.
01:20:37 So for example, if you have two threads and the threads are both calculating CPU,
01:20:41 they will fight for the guild.
01:20:43 So they will kind of move the guild back and forward.
01:20:45 And then you can see in the timeline what thread has the guild and for how much.
01:20:49 So that you can see, oh, you know, this thread ran for like 20 milliseconds.
01:20:53 And then this other thread ran for like 10 milliseconds.
01:20:54 And you can see how it's been bounced.
01:20:57 So you can like calculate maximum throughput and things like that.
01:21:01 Yeah, that contention is a big challenge of multi-threading.
01:21:04 Exactly.
01:21:04 You said that stuff doesn't scale linearly, like 10 threads don't give you 10x performance,
01:21:08 and that's a good reason right there.
01:21:10 Exactly, and this can give you a more or less good answer for that, perhaps not perfect,
01:21:14 but...
01:21:14 You guys, there is so much here.
01:21:16 There is so much here.
01:21:17 But we're also so much out of time, I think.
01:21:19 I mean, people should check this out.
01:21:21 There's really a lot that you can...
01:21:23 I'm super impressed with this, Pablo and Laszlo.
01:21:25 Well, thank you.
01:21:26 Thank you very much.
01:21:27 Thank you.
01:21:28 There was a really good presentation on PyCon this year, which has a little bit more info.
01:21:34 I also remember because you mentioned how much there is here.
01:21:36 And I remember working on the slide and I was just panicking how we're going to get all this information into this half an hour talk.
01:21:43 What's our talk?
01:21:44 30 minutes?
01:21:45 Oh, uh-oh.
01:21:46 No, no, it's impossible.
01:21:49 Yeah, that presentation.
01:21:51 But I also recommend that for anyone who's interested.
01:21:55 I think that has a pretty good overview.
01:21:57 Yeah, I'll definitely link to your talk on YouTube.
01:22:00 There is only one thing I want to add before we go, which I think is interesting and it's also a bit, you know, selfish,
01:22:07 which is that, so Tachyon is really good.
01:22:10 The only interesting challenge of Tachyon is that, you know, if your application spends a bunch of time in C code,
01:22:18 like NumPy or, you know, Pandas or Polars or like nowadays, like all the machine learning stuff like CUDA or whatever it is.
01:22:25 Unfortunately, again, like Tachyon is a Python profiler.
01:22:28 So it only sees Python, right?
01:22:30 It is who calls that C code, but not the C code.
01:22:32 And of course, you can say as a user, you are not super interested in what is happening on the guts of NumPy.
01:22:39 But sometimes you are, right?
01:22:40 Because what is going on or why my application is low, sometimes you need to just go there.
01:22:45 That's the unfortunate life we live in.
01:22:47 And Tachyon cannot analyze C code because it's a Python profiler.
01:22:51 It's not a C profiler.
01:22:52 On the other side, a C profiler cannot analyze Python.
01:22:55 So you can only see C code.
01:22:58 So you will see the internals of CPython, but it will not have Python names.
01:23:01 It will not tell you full bar batch.
01:23:03 It will tell you by valuable frame default, and that's not useful.
01:23:06 So that is one big challenge.
01:23:08 And the other is that the moment you want to go into the world of C profilers,
01:23:12 complexity explodes.
01:23:14 It's just like, if this is hard, which is hard, when you want to do C profiles,
01:23:19 it's like 10 times harder.
01:23:20 And then when you want to do both at the same time, it's a million times harder.
01:23:24 So unfortunately, we didn't want to add that complexity to the standard library because,
01:23:29 you know, it's a lot of complexity for core developers to maintain.
01:23:32 And it's also really, really, really hard.
01:23:35 It's extremely hard and it requires a lot of care and, you know, bugs will happen.
01:23:40 So we didn't want to like put.
01:23:41 So one of the things I've been working on here at Hudson River Trading is a version of
01:23:45 Tachyon is like the big brother of Tachyon, which is called Cronon, which is also physics
01:23:49 related because like the in quantum mechanics if you quantize time the particle of time is called
01:23:55 a chronon so you know because it's time because it's processed so we call it chron and this is a
01:24:00 profiler we have been using for nine months already here for with extreme success extreme success like
01:24:06 the whole company is using it all the time and this profiler does everything that tackian does
01:24:11 but it's also multiple versions of python so you can profile 312 313 314 315 all that you want and
01:24:18 also profile C code and kernel code.
01:24:20 So you can see literally everything.
01:24:22 Like you can see something like, oh, your application is calling, I don't know, calculating Python and that goes into NumPy
01:24:29 and that's creating a bunch of arrays.
01:24:30 But one of those arrays just trigger a page fall in the kernel and then the kernel is like trying to find memory for you. So you can see how much that takes.
01:24:38 And it supports the streaming.
01:24:39 So you can have like Grafana dashboard with all the profile and The Flame Graph is changing as your application is running,
01:24:46 so you don't need to even wait for it.
01:24:49 You don't need to attach even.
01:24:50 You can just keep it 24-7 and see the data as it comes in.
01:24:54 It supports all sorts of formats, all sorts of tools.
01:24:58 It works on macOS as well and Linux.
01:25:02 So we are going to make it open source soon in a month or two.
01:25:06 Yes, and that's going to be a big deal, big deal.
01:25:09 Cool.
01:25:09 Secret sauce.
01:25:10 Yeah, that sounds amazing.
01:25:12 I mean, already, Takion is very amazing.
01:25:14 Alas, it will be known as profiling dot sampling.
01:25:17 Yes, yes, yes.
01:25:18 We now know.
01:25:19 Most people call it Takion.
01:25:20 Most people call it Takion.
01:25:21 Call it Takion.
01:25:22 That's the real name.
01:25:23 The other one is the, you know, the name that you need to use when you go to boring meetings
01:25:28 with, like, suits and, like, you know, companies.
01:25:31 Companies, oh, who are you Takion?
01:25:32 No, no, I'm profiling dot sampling.
01:25:34 Oh, okay, okay.
01:25:35 But, like, no, no.
01:25:36 When you go to the party.
01:25:36 We trust this one, yeah.
01:25:37 It's not one of the more weird physics things.
01:25:40 Everyone should just call it Tachyon until it spreads and it just becomes the name.
01:25:44 Yeah, yeah.
01:25:44 No one will understand what you're talking about profiling or something.
01:25:47 If you talk to your manager, you say, oh, I use profiler or something.
01:25:50 Oh, okay.
01:25:51 But like, no, with your friends, you say, I use Tachyon and I fucking did it.
01:25:57 Oh, okay.
01:25:57 That's right.
01:25:58 Who is this Tachyon?
01:25:59 Why does he solve it?
01:26:00 Yeah, who is this guy?
01:26:01 Who is this guy?
01:26:02 Well, thank you guys, Pablo, Laszlo.
01:26:04 Thanks for being on the show.
01:26:05 Awesome work on getting this out to the world.
01:26:07 This is going to be super cool for everyone.
01:26:09 It's going to be great.
01:26:10 Thank you so much for hiring us, and I hope people enjoy it.
01:26:13 I'm sure they will.
01:26:14 All right.
01:26:15 Thanks a lot.
01:26:16 Bye, guys.
01:26:16 See you.
01:26:16 Thank you.
01:26:18 This has been another episode of Talk Python To Me.
01:26:21 Thank you to our sponsors.
01:26:21 Be sure to check out what they're offering.
01:26:23 It really helps support the show.
01:26:25 This episode is brought to you by Sentry.
01:26:27 Sentry's new MCP server connects your error reports straight to your coding agent.
01:26:32 Claude Code reads the errors, finds the bugs, and fixes them.
01:26:35 Get started at talkpython.fm/sentry.
01:26:39 If you or your team needs to learn Python, we have over 270 hours of beginner and advanced courses on topics ranging from complete beginners to async code, Flask, Django,
01:26:49 HTML, and even LLMs.
01:26:51 Best of all, there's no subscription in sight.
01:26:54 Browse the catalog at talkpython.fm.
01:26:56 And if you're not already subscribed to the show on your favorite podcast player,
01:27:00 what are you waiting for?
01:27:02 Just search for Python in your podcast player.
01:27:04 We should be right at the top.
01:27:05 If you enjoy that geeky rap song, you can download the full track.
01:27:08 The link is actually in your podcast below or share notes.
01:27:11 This is your host, Michael Kennedy.
01:27:12 Thank you so much for listening.
01:27:14 I really appreciate it.
01:27:15 I'll see you next time.
01:27:34 Get old.
01:27:36 We tapped into that modern vibe.
01:27:39 Overcame each storm.
01:27:40 Talk Python To Me.
01:27:42 I sync is the norm.