Tachyon, Python 3.15's Built-in Sampling Profiler: A Visual Guide to Talk Python Episode 565
TL;DR: Python 3.15 ships Tachyon, a sampling profiler in the standard library under the name profiling.sampling. It reads a running program's stack from a separate process, so it can attach to a live production app by PID at close to zero cost. The first prototype managed two samples a second. It now does over a million.
Ask a developer why their program is slow and you'll usually get a confident answer. It's often wrong. Michael Kennedy, host of Talk Python, learned this the hard way: he was certain that 6,000 lines of complex math were slowing his program down. Then he attached a profiler. The math was fine. The real culprit was the wrong data structure - a list where a set or a dictionary belonged.
That's a far more common story than people think. Modern software has so many layers that nobody can guess what's costing them, and Pablo says it happens in the smallest shops and the biggest. So you measure.
For most of Python's history, measuring came with a catch. The built-in profilers made your code two to three times slower and distorted what they measured, and the third-party tools had to reverse engineer the interpreter, so they broke with each new Python release. Python 3.15 fixes both problems with Tachyon, a sampling profiler built into the standard library.
This guide covers how Tachyon works, why it belongs in CPython, and what it can show you, from a plain list of your slowest functions to async task views and live production profiling.
Tracing vs. sampling profilers: why profile and cProfile slow Python down
Python has shipped two profilers for decades, profile and cProfile. Two tools for the same job is a little odd, and the reason is history.
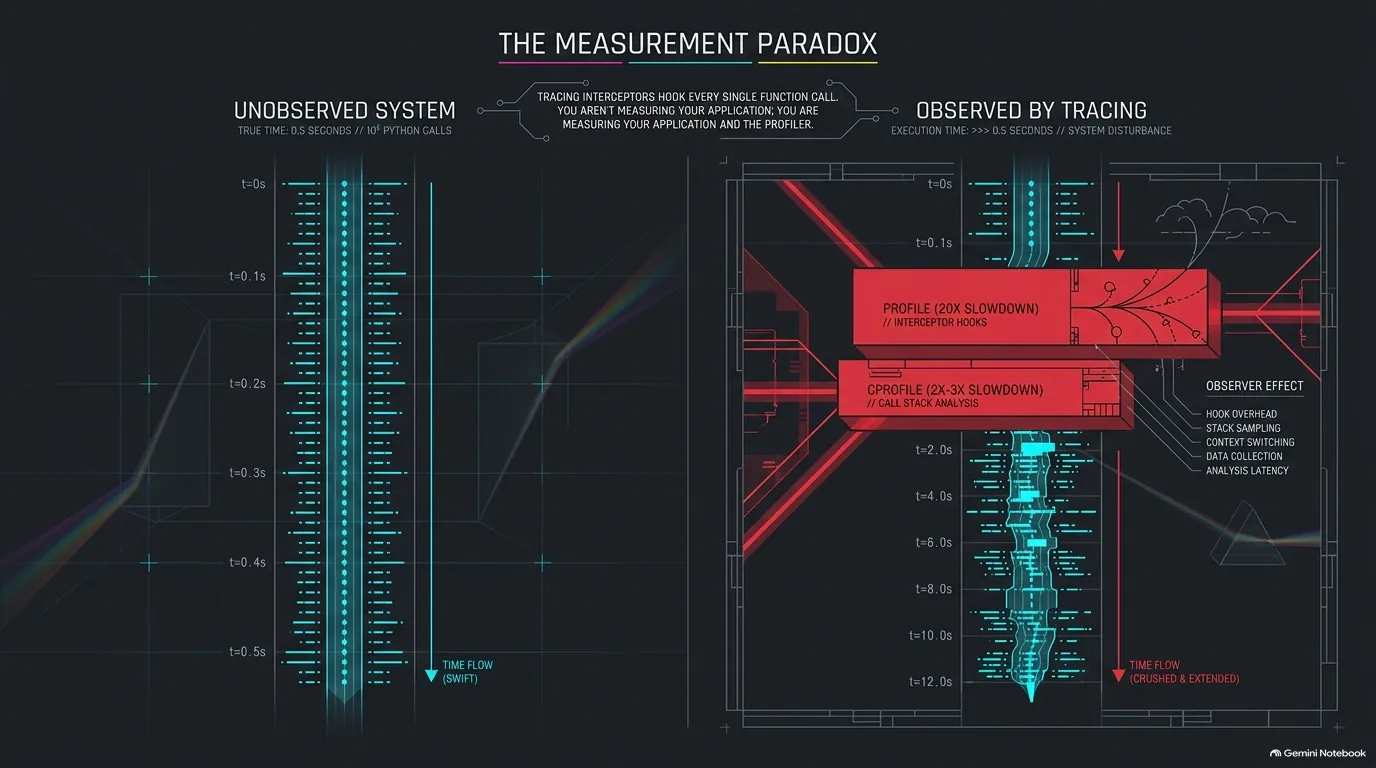
profile came first, and for its time it was a good design. But it's written in Python and runs inside the very program it measures, which slows that program down by around 20 times. It even tries to estimate and subtract its own overhead, a trick Pablo Galindo Salgado calls flaky. cProfile reimplements the same idea in C and runs about 10 times faster than profile. That still makes your program two or three times slower, so a five-minute job takes 15. (Even the name trips people up. Lowercase c, uppercase P - Pablo admits he still forgets which is which.)
Both are tracing profilers. They hook every single function call and record it. That's where the cost comes from, and it's also their strength: if a tracing profiler says a function ran seven times, it ran seven times. It's why Memray, a memory profiler, traces too. Miss one allocation and it might be the one-gigabyte allocation you were hunting. So cProfile isn't going anywhere, and it shouldn't.
The bigger problem is that tracing doesn't slow everything down evenly. Picture two functions that each take half a second. One hits the file system a million times in a tight loop. The other makes a single slow API call. Under a tracing profiler, the first looks far worse, because it pays the overhead on a million intercepted calls. By observing the program, you've changed it. (That sounds like quantum mechanics, but Pablo, a physicist by training, objects: a real program was already fast or slow before you looked. The profiler just makes it slower.)
There's a practical cost too. Tracing a full application is too slow, so people profile a small test case instead, and the familiar story follows: it's slow in production, but the local profile looks fine. László Kiss Kollár adds that the docs never made it clear when you'd pick one profiler over the other, so everyone just reaches for cProfile.
A sampling profiler takes the other path. Instead of intercepting every call, it looks at the stack at a fixed rate and builds a statistical picture. You give up exact counts in exchange for a far smaller impact, and that trade is what Tachyon is built on.
“You don't need to be a profiler expert to know that you're doing extra work to measure the work that is going to skew the results. Because now you're not measuring your application. You're measuring your application and the profiler at the same time.”
Pablo Galindo Salgado
Why put a profiler in the standard library when py-spy and Austin exist?
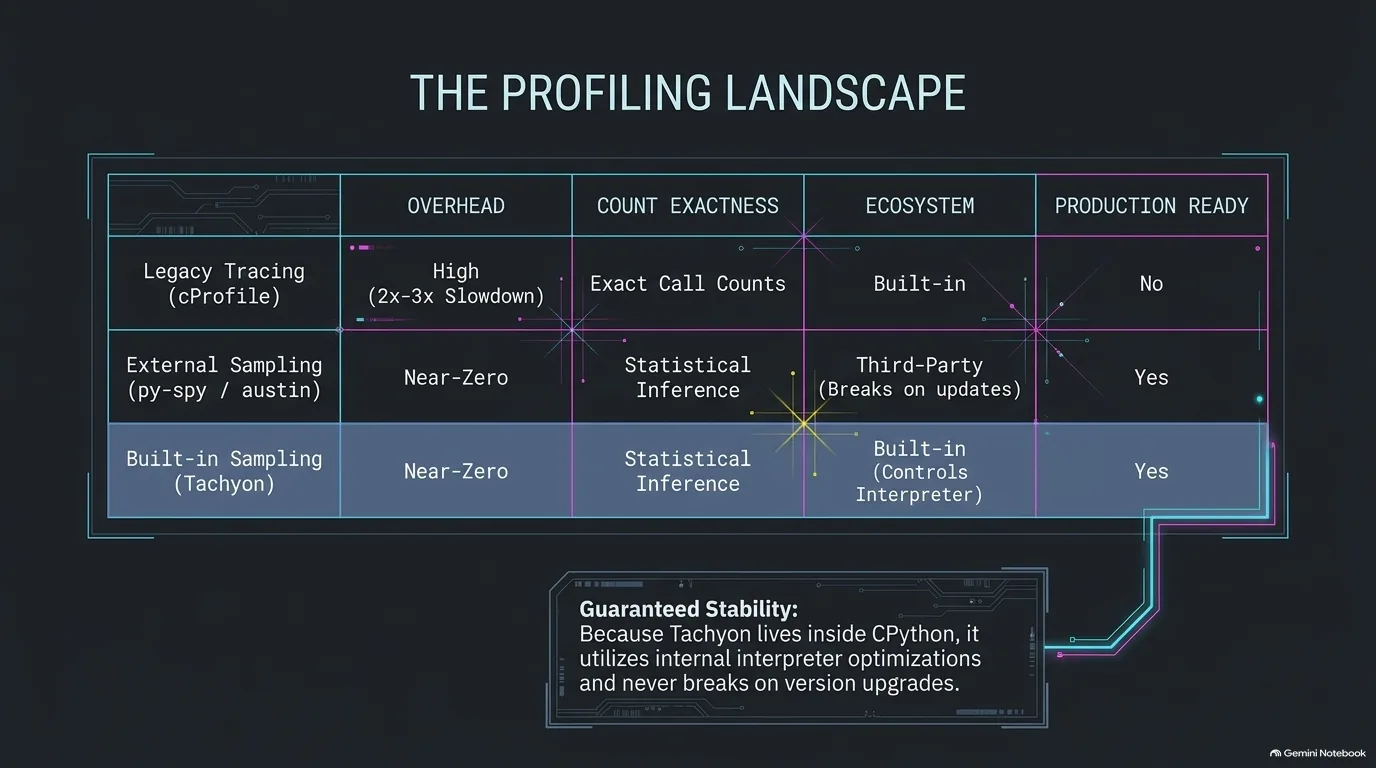
Sampling profilers for Python aren't new. The best known is py-spy, written in Rust, which Pablo calls a very good piece of software. Austin is another. So why build another one into CPython?
The first reason is structural. A profiler that runs outside your program has to understand the interpreter's internals, and those internals aren't a public API. The core team historically didn't treat that use case as something to preserve, so releases kept changing things in ways that made life hard for py-spy and Austin. Profiling 3.11 was much slower than profiling 3.10, and some changes made profiling outright impossible. With Tachyon in CPython, that flips. Attaching to a running interpreter becomes a feature Python promises, and the profiler doubles as a reference implementation. If CPython can do it, anyone can: read how Tachyon does it and do the same.
The second reason is quality. Tachyon touches delicate internals, and the core team wants the batteries-included tool to handle every edge case they know about. It's not that they don't trust the other tools, Pablo says. They want users to have a very good reason to use the built-in one.
The third reason came out of building Tachyon. When you're working on a CPython alpha, no third-party profiler supports it yet. László hit exactly that while trying to profile Tachyon's own fairly complex Python code.
There's a catch. Tachyon relies on interpreter changes added in 3.15, so it can only profile 3.15 processes, from 3.15. py-spy will attach to 3.12, 3.13 or 3.14 today, with varying performance. A future 3.16 might be able to profile 3.15 as well, but the core team hasn't decided whether to take that on. The promise is that the feature keeps working in each new Python. It doesn't mean one version's Tachyon can profile every other version.
What about 3.14 today? A community project, pythonbackport/python-profiling, packages the profiler for it. It copies CPython's _remote_debugging code, strips the 3.15-only tricks, and its setup.py pins it to 3.14, which makes sense since it still needs 3.14's debugging interface. Pablo is happy to see people pull tricks like this, though a 3.14 bug report sent his way might get a "hey, man, what are you doing?" László tried the same backport himself and found the patch enormous, with every patch version to maintain, so he dropped the idea of a separate package. Michael sees it as useful in the first year, not as a long-term path.
“So that we ensure that this is a feature that Python offers and will never break.”
Pablo Galindo Salgado
profiling.sampling, PEP 799 and why everyone calls it Tachyon
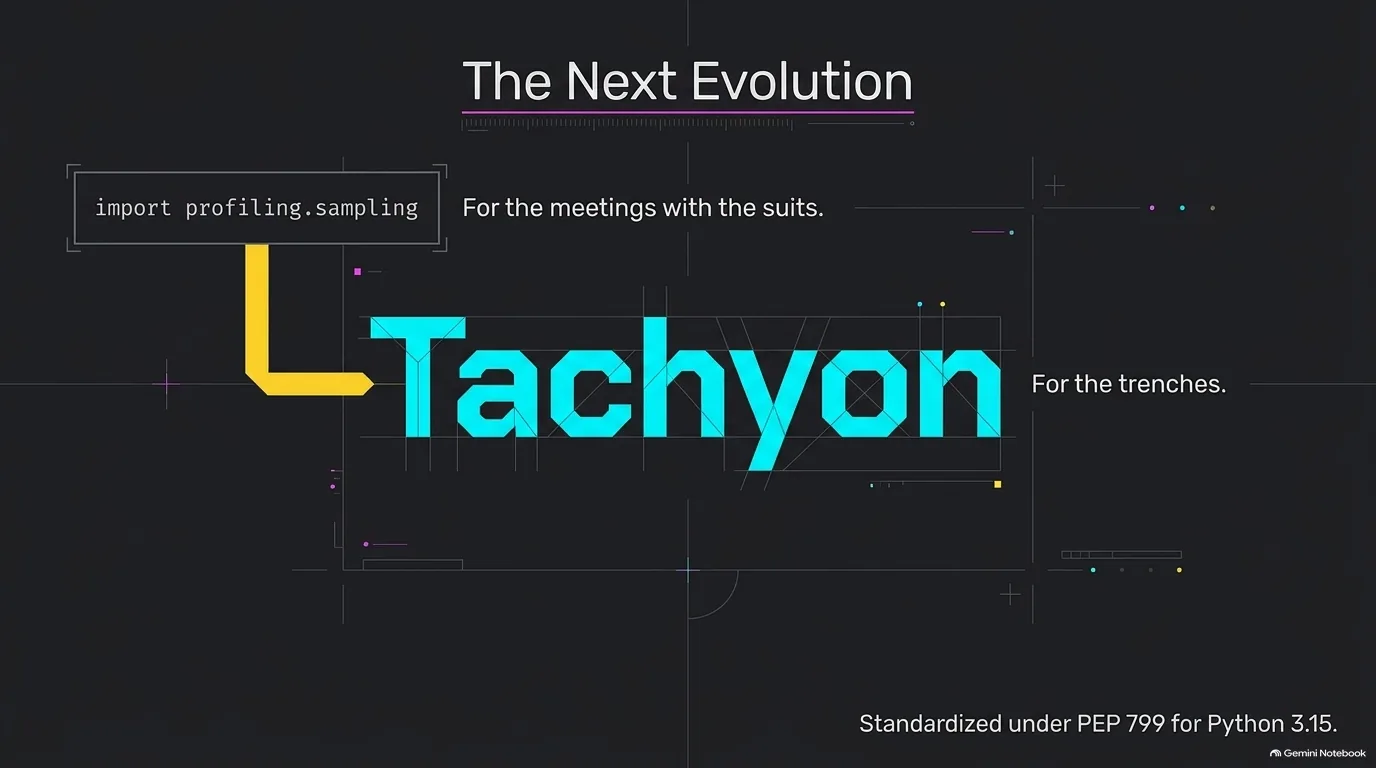
The plan was never to add a whole new package. The sampling profiler was first meant to go inside the existing profile package, and that turned out not to be possible. So the authors cleaned house instead. PEP 799 creates a profiling package with two clearly named halves:
profiling.tracingis cProfile in its new home. ThecProfileimport keeps working for compatibility.profiling.samplingis Tachyon, the new sampling profiler.
The old pure-Python profile module is deprecated, with warnings in 3.15 and 3.16 and removal in 3.17, about two years out. The goal is ergonomics. You get one tracing profiler and one sampling profiler, and the name tells you which is which. If you know the profiling vocabulary, the import tells you exactly what you're getting.
The only complaint is that it's a mouthful. Almost all the time, profiling.sampling is the one you want, and typing it gets old. Pablo would like to convince people to give 3.16 a top-level tachyon command, the same way you get a pip command with Python. The ideas on air got silly fast. László proposed a C-Tachyon module to confuse everyone. Michael suggested publishing a package called Tachyon that just imports the real thing (one already exists, Pablo said). Pablo floated bribing Charlie Marsh for a uv command.
The official name, in Pablo's telling, is for boring meetings with suits. Among friends, it's Tachyon. And where does that name come from? Physics. A tachyon is a hypothetical particle that moves faster than light. Special relativity doesn't forbid one. Light moves at exactly light speed, things with mass stay below it, and something could in principle live above it. Nobody has seen one, and it's very likely they don't exist - among other things, tachyons would travel back in time. "Tachy" is Greek for fast.
The headline for 3.15 users is simpler. Tachyon runs as a separate process and reads the target's stack from outside, so the profiled program doesn't know it's being watched. It works the same way on macOS, Windows and Linux.
“Everyone should just call it Tachyon until it spreads and it just becomes the name.”
László Kiss Kollár
How PEP 768 made Tachyon possible: from 2 Hz to over a million samples a second
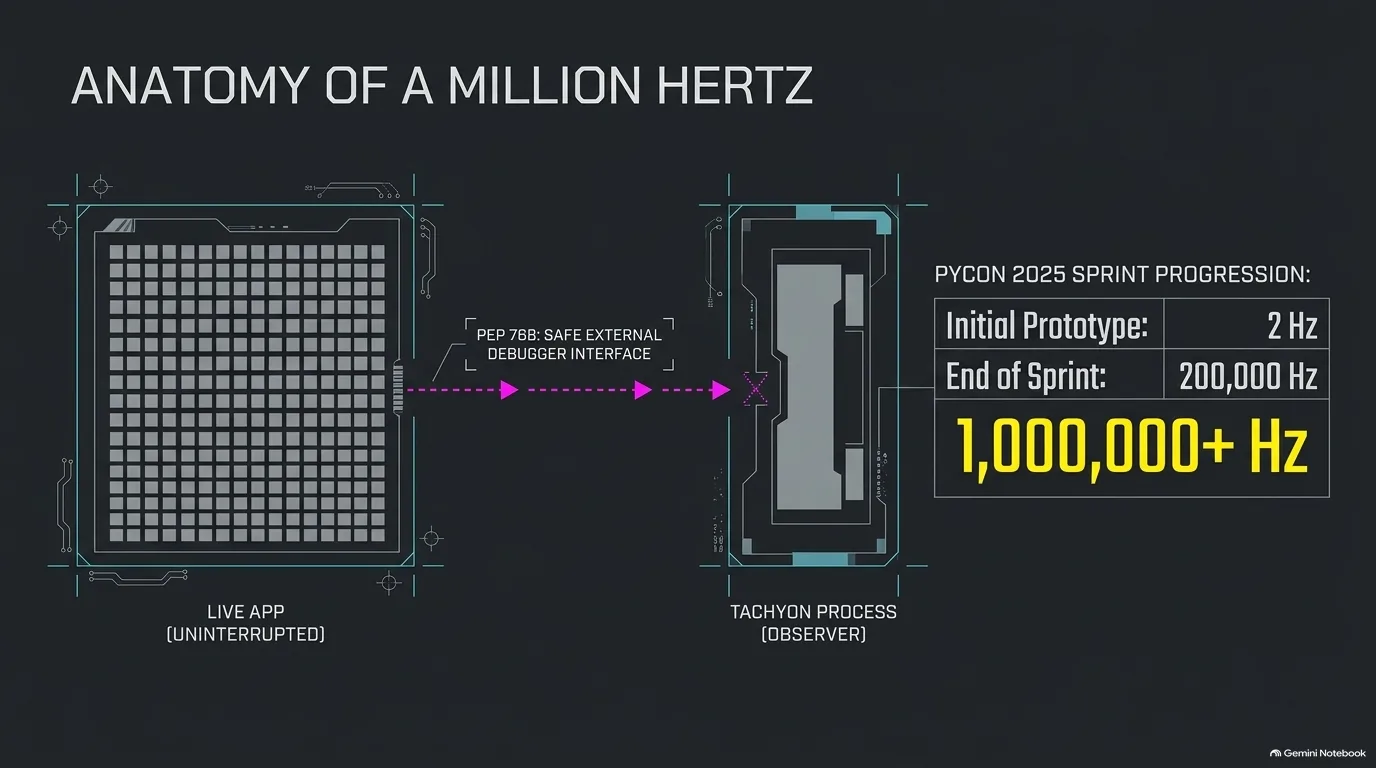
Tachyon sits on top of earlier work. PEP 768, which shipped in Python 3.14, adds a safe external debugger interface to CPython. Pablo built it with colleagues at Bloomberg, and the north star was letting pdb, or any debugger, attach to a program already running in production. Instead of stopping a misbehaving process and restarting it under a debugger, you'd attach and ask what's wrong. To make that work, CPython gained the machinery for another process to inspect a running interpreter, stack and all.
A debugger asks a program what it's doing. A sampling profiler asks the same thing - "Where are you?" - over and over, a million times a second if you like. So at the PyCon US 2025 sprints, Pablo walked over to László with a question: "would it be cool to call this in a loop?" Read the stack, record it, repeat, and you have a sampling profiler.
How fast does that loop need to be? Around 100 samples per second is the minimum for a profiler to be useful at all. Their first loop ran at two, which Pablo describes as not fantastic.
The plan had been for Pablo to make the core fast while László built the CLI and the machinery around it. Two hertz ended that plan, and they spent the rest of the sprint on performance. At first, every change bought another 10x, which, László admits, is easy when you start at two samples a second. By the end of the sprints they were at 100,000 to 200,000 samples per second. Pablo later found another 4x to 5x, which put Tachyon past a million. Then came the headline: the fastest sampling profiler for Python.
Pablo is careful about that title. Tachyon has an extra trick that py-spy and Austin don't: it lives in CPython, so the core team can change the interpreter purely to make sampling faster. They "can cheat a bit," as he puts it. Those tricks are now in the interpreter for any profiler to use, and he doubts the fastest title will last long. That turned out to be a hint about his next project.
This is also why Tachyon needs a recent Python. The basic interface arrived in 3.14, and the full, fast version depends on 3.15's interpreter changes.
“And then we literally spent the entire rest of the sprint working on that. I think we actually ended up with no code committed during the sprint. All of the actual commits went in later on.”
László Kiss Kollár
Run, attach or dump: three ways to use Tachyon
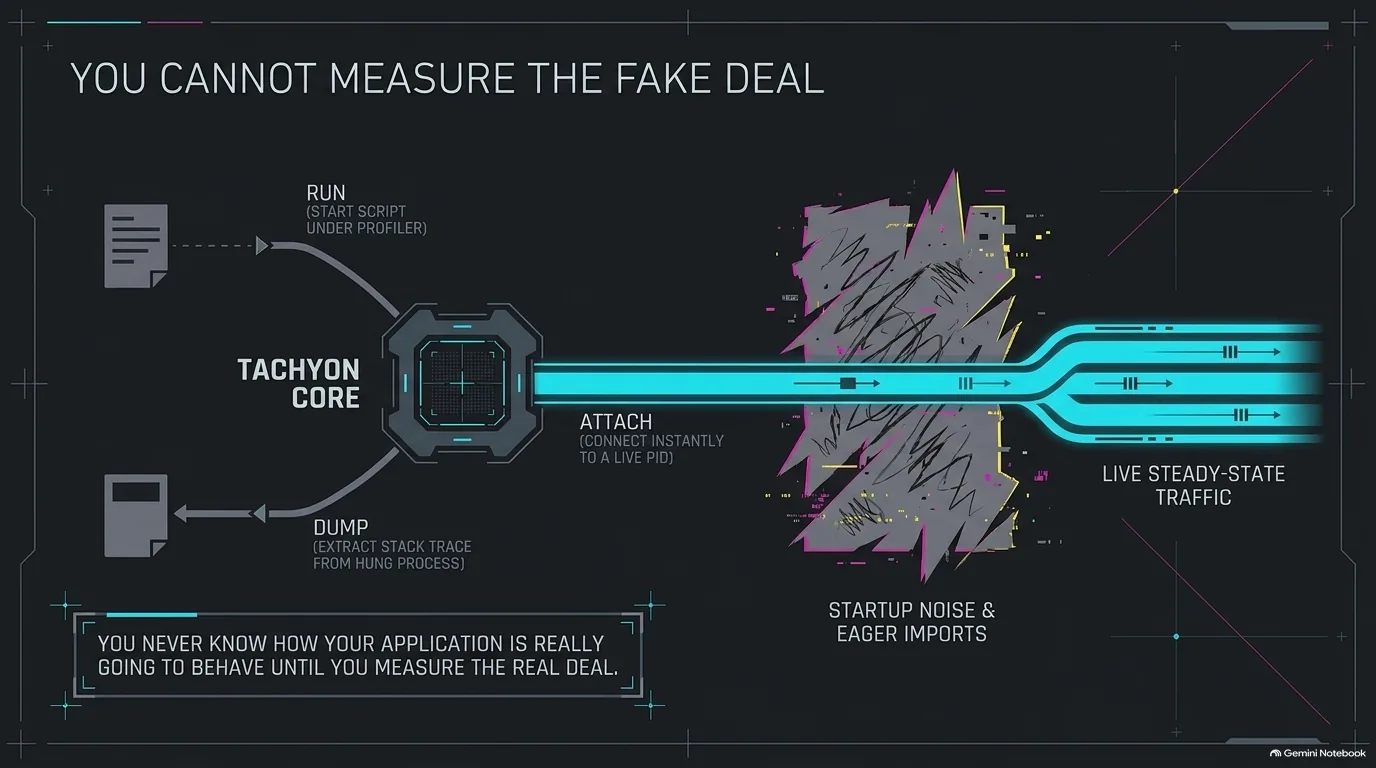
Attaching to a live process gets the headlines, but Tachyon isn't only for production emergencies. It has three entry points, and each fits a different job.
Run. Start a script or module under the profiler and it samples from the first line. This is the development case: a test suite, a sample program or a slow CLI tool. Some of the reporters are built for exactly this, so you can take two snapshots, before and after a code change, and see how much faster or slower things got.
Attach. Point Tachyon at the PID of a program that's already running. Pablo thinks this matters more than launching under a profiler, because you rarely get to reproduce the real situation in a lab. It also fixes a long-standing annoyance. Profile from startup and what you care about gets buried under imports and setup, which are just noise. Michael used to work around that by writing code to switch the profiler off and turn it on only for the part he was interested in. With attach, you connect once the app is up, do the couple of things you want to measure, and detach.
Dump. If an app is frozen in a deadlock, or waiting on I/O that never arrives, dump with the PID prints where it's stuck right now (add -a for every thread). It's like the stack trace you get from an exception, without anything being raised.
To make that concrete, here's each one on the command line:
# Profile a script, or a module such as your test suite, from the first line
python -m profiling.sampling run script.py
python -m profiling.sampling run -m pytest

# Attach to a process that's already running
python -m profiling.sampling attach 1234

# Print the current stack of a hung process
python -m profiling.sampling dump 1234
All three work the same way on macOS, Windows and Linux, with the same guarantees. Sample at a low rate over long periods and you could even build continuous profiling on top.
Why does it matter that attach comes built in? In László's experience, the worst moments, when things are blowing up, are exactly when you don't have profiling tools ready. Now all you need is 3.15 installed and running in your application.
“But I think it's also important to emphasize here that Tachyon is not just a production profiler.”
László Kiss Kollár
Is it safe to profile Python in production? Tachyon's overhead and the --blocking flag
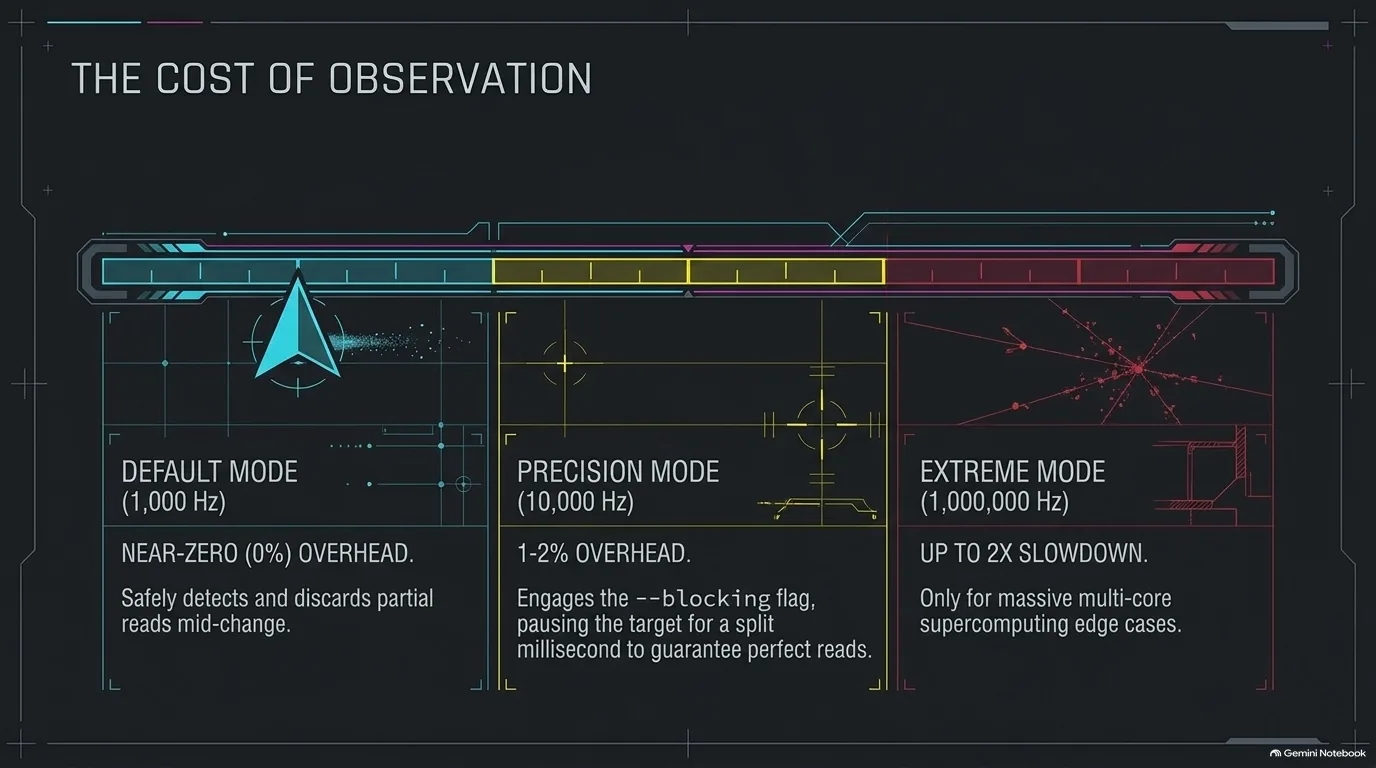
If you attach a profiler to something running in production, what does it cost you? Pablo's short answer: "It's free." The fine print takes a little longer.
By default, Tachyon never stops your application. It only reads memory from the outside, at 1,000 samples a second unless you ask for another rate. The application doesn't know it's being profiled and runs at full speed. The one exception is a machine where the app and the profiler share a single CPU core, like a Docker container limited to one core.
Reading memory that's still changing has a catch, though. A sample can land on a data structure halfway through an update. Tachyon detects most of these partial reads and throws the sample away, so if it happens a lot, you just end up with fewer samples. Generators are a common cause.
If you want every sample to be consistent, add --blocking. Before each read, Tachyon pauses the target for a split millisecond, takes the sample and lets it go. You can add the flag at any rate, and what it costs depends on how fast you sample. At the default rate, or anything up to 10,000 samples per second, the slowdown is 1% to 2%. Push to 100,000 samples a second and you're looking at 20%, 30%, even 80%. At a million, if your machine can do it at all, it's around two times slower. You have to go really crazy to get there.
Compare that with cProfile, which makes your program two to three times slower. If you've profiled Python before, you'll notice how much lower this is.
Pablo's advice for production is practical. Sample at 100 to 1,000 Hz and the cost is a percent or two. Attach for a bunch of seconds, detach, then go reason about the data. Even if blocking cost you 50%, a few seconds of it would be fine.
For example, to sample a live process for 30 seconds:
# Default: no pausing, 1,000 samples a second
python -m profiling.sampling attach -d 30 1234

# Consistent reads: pause the target briefly for each sample
python -m profiling.sampling attach --blocking -r 10k -d 30 1234
“So 1% to 2%, not two times. It's 1% to 2%. It's nothing.”
Pablo Galindo Salgado
Tachyon's output formats: from a list of slow functions to flame graphs and Gecko timelines
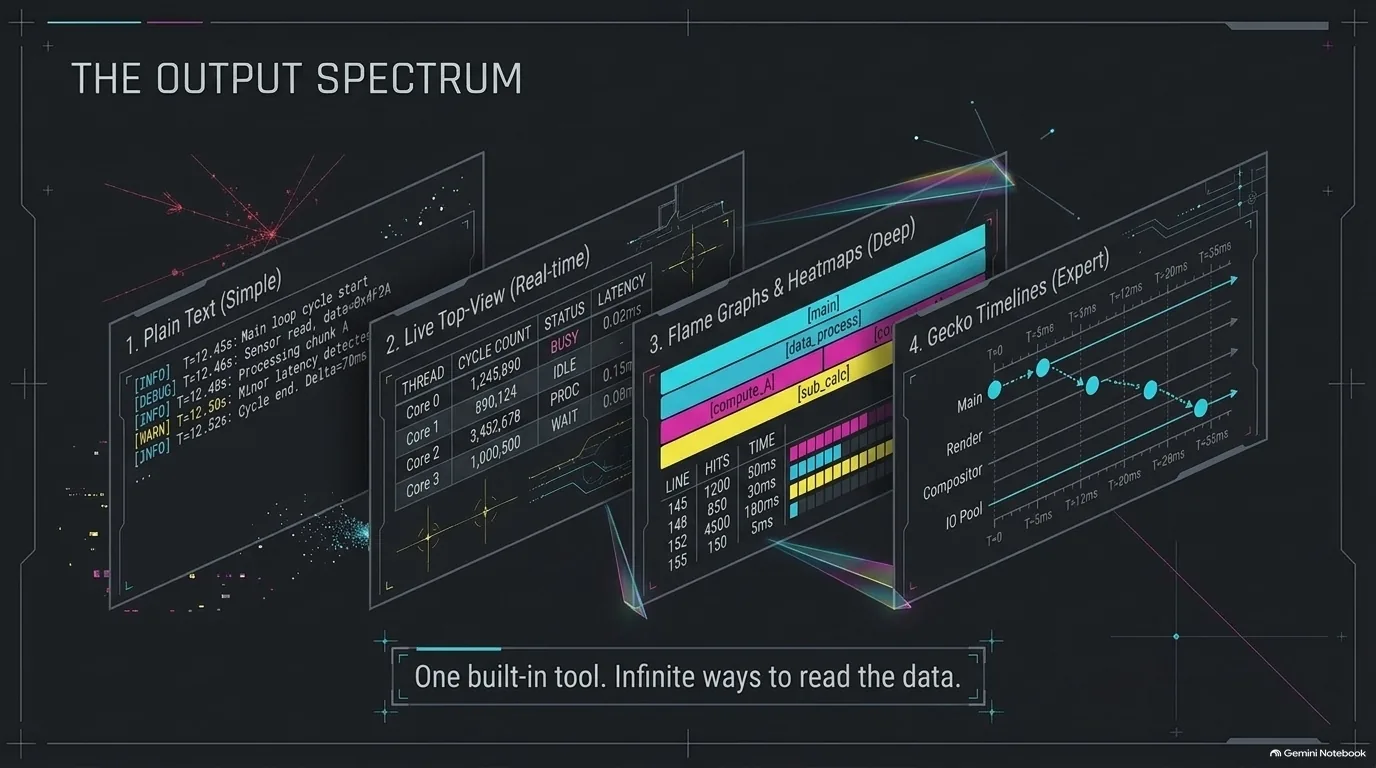
The profiling.sampling documentation is long. Why so much? Because the tool does so much. cProfile hands you the pstats format and some basic statistics. Tachyon, in Pablo's words, is "a full beast."
It's meant to be useful to a very wide range of developers, so the outputs run from beginner-friendly to expert:
- Just tell me what's slow. By default, Tachyon prints a short table of the functions where your program spends its time. You don't need to know how to read a flame graph. Bam, here are the slow functions, go look at them.
- Live view. Like running
topto watch processes, the live mode shows your application's functions updating as it runs. - Flame graphs and heat maps. Flame graphs show the call stacks where time goes. Heat maps color your source lines by how hot or cold they are.
- Differential flame graphs. Run your program, change something, run it again, and Tachyon shows which functions got faster and which got slower.
- Opcodes. For experts, there's a mode that looks at individual bytecode instructions.
- Gecko. This format opens in the Firefox Profiler and gives you a timeline per thread.
Each of those is a flag. For example:
python -m profiling.sampling run script.py                # table of the slowest functions
python -m profiling.sampling run --live script.py         # top-style live view
python -m profiling.sampling run --flamegraph script.py   # interactive HTML flame graph
python -m profiling.sampling run --heatmap script.py      # line-level heat map
python -m profiling.sampling attach --gecko 1234          # for the Firefox Profiler
Gecko has a secret. There's an unadvertised mode called "all" that only makes sense with that format. It records every sample and tags each one with what was going on, CPU or not. The result is a set of lanes showing what every thread was doing. If two threads are both crunching numbers, you can watch them pass the GIL back and forth, see that one ran for 20 milliseconds and the other for 10, and estimate your maximum throughput.
That kind of contention is a big reason 10 threads don't give you 10 times the performance, and this view lets you see it happen. Pablo's caveat is that it gives a more or less good answer, perhaps not a perfect one.
“Something that we try to do with Tachyon is that it tries to be useful to a very big range of developers.”
Pablo Galindo Salgado
Profiling asyncio code: seeing the tasks that are waiting
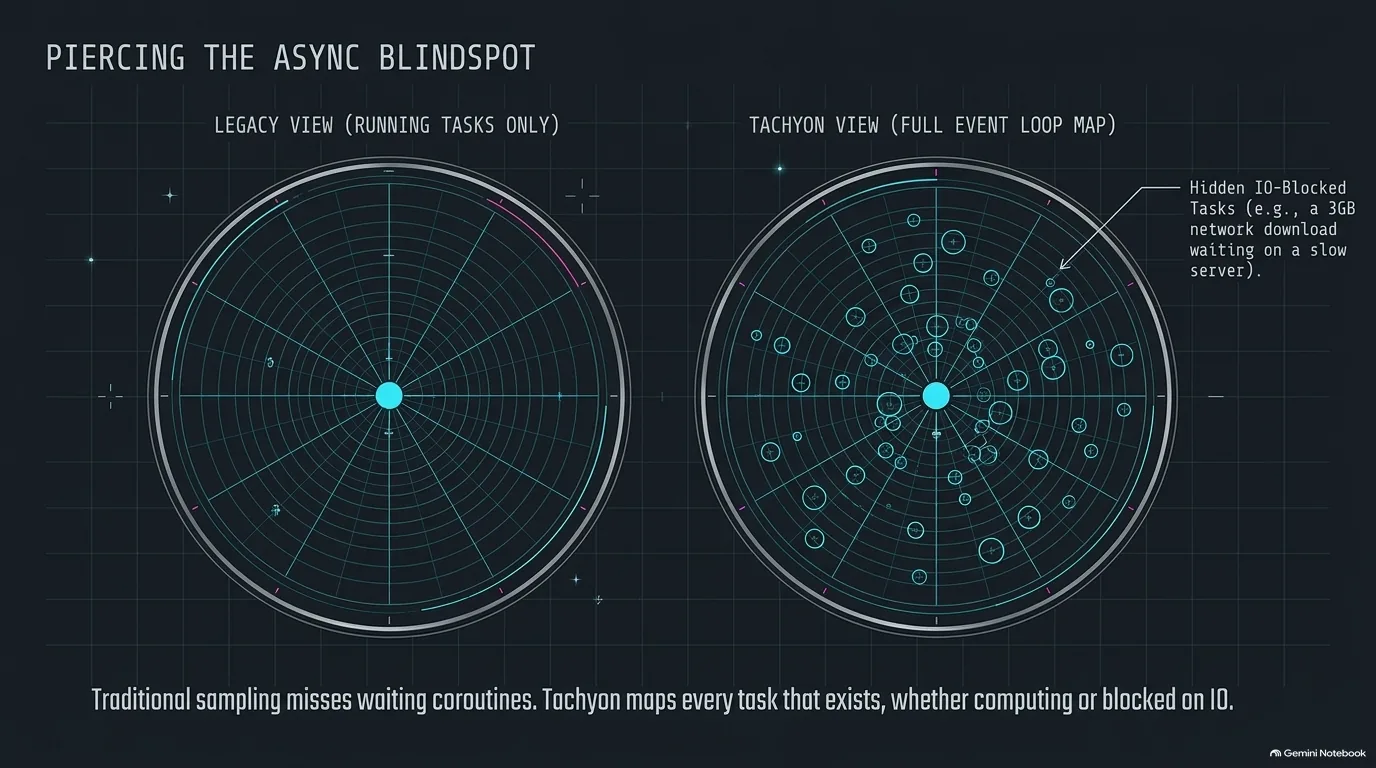
Async code is a blind spot for most profilers, and Pablo counts Tachyon as the first one that can properly handle asyncio. Why is it so hard? Because the event loop does all sorts of weird things. There's often one thread, and the answer to "what are you doing?" is basically "we're dispatching."
The real problem shows up when your program is slow because it's waiting. Say you're downloading a 3 GB file from a slow server. Nothing is crunching. In synchronous code, a profiler would show you sitting in a read call over and over, and you'd figure it out. With asyncio, the event loop only wakes up when the server sends something. In between, the waiting coroutine isn't running, so a profiler that only sees running code never records it. The thing that makes your program slow never shows up in the flame graph.
That hits sampling profilers hardest, since a sampler can't see a task go into and out of a wait. Tracing isn't the answer either. In an event loop you keep hopping from task to task, and the trace becomes very confusing.
Tachyon's answer is an async-aware mode with two views:
- Running tasks. Only the tasks that are executing when each sample is taken. The task waiting on the download won't show up, but you see what work happens in the meantime.
- All tasks. Every task that exists at each sample, including the ones blocked on I/O. The download task never advances, so it appears in sample after sample, and you finally see where the time goes.
On the command line, that's:
# Only the tasks that are running
python -m profiling.sampling run --async-aware script.py

# Every task, including the ones waiting on I/O
python -m profiling.sampling run --async-aware --async-mode all script.py
The async-aware mode can't be combined with the --mode filters (CPU, GIL and the rest), so this is a separate way of looking at your program rather than an extra layer on top.
“So like if you can only see the coroutines that are running, the fact that you are waiting for the server to send your data will never appear in your flame graph because it's not happening.”
Pablo Galindo Salgado
Wall clock, CPU, GIL and exception modes: filters over the same samples
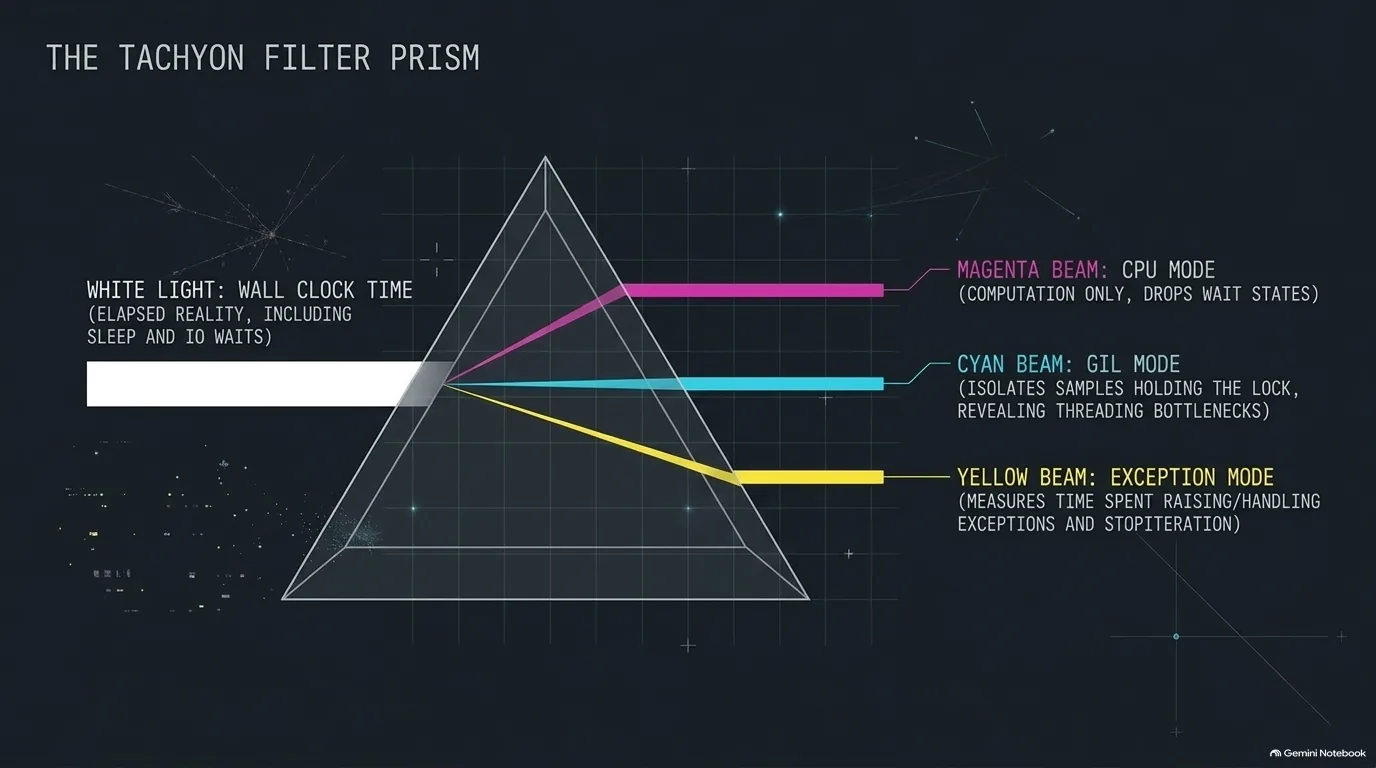
Tachyon has wall clock, CPU, GIL and exception modes. They sound like four different profilers, but they aren't. The profiler looks at your program from time to time and takes notes on what it's doing. The modes are just filters over those samples.
Wall clock is the default and counts everything. If your program calls sleep(5), the profiler correctly tells you five seconds went to sleeping. That's true, and it's sometimes useful, but you can't fix it. The name comes from the clock on the wall: it measures the time that actually passed.
CPU mode keeps only the samples where your program is actually computing, and drops the ones where it's sleeping or waiting on disk or the network. Picture two threads, one waiting on the network and one calculating pi. Wall clock says half your time goes to the network, but you can't make the network faster. The CPU samples are the ones you can improve with a better algorithm or a faster module. Both views are useful together. Say you're reading and parsing JSON. Knowing that 30% of the time is waiting for the file is interesting, but you can't fix the file system. You can switch to a faster JSON parser.
GIL mode keeps only the samples taken while the GIL is held. That answers a subtler question. Take a function that calls into NumPy and spends 10 seconds there, but only holds the GIL for one of them. In the other nine, other threads are free to run. So in a multithreaded program, GIL mode shows you what's preventing everything else from running. Pablo admits it's harder to understand than CPU or wall mode, and it's for people already deep in the weeds.
Exception mode measures how much time goes to raising and handling exceptions. That sounds negligible until you remember exceptions are used for more than errors. The iterator protocol raises StopIteration as control flow. Michael's example was parsing a CSV where you try to convert each field to a number and fall back to None on failure. In a tight loop, a regex check or some other test instead of an exception gets you a big bonus.
Switching modes is one flag:
python -m profiling.sampling attach --mode cpu 1234
python -m profiling.sampling attach --mode gil -a 1234
python -m profiling.sampling attach --mode exception 1234
The -a flag samples all threads instead of just the main one, which is what you want when you're asking who holds the GIL.
“In particular, CPU wall exception and GIL are filters over the samples such that you can know what is your application exactly doing and what is not doing.”
Pablo Galindo Salgado
Profiling live production data: the accidentally quadratic algorithm at HRT
Why does attaching to a live process matter so much? Because a lot of the time you need to see live traffic to understand why a program is slow or how to make it faster. And most of the time you can't just launch your application under a lab profiler. It's already running, it's doing something weird, and you need to look at it right there.
Pablo was emphatic on this point. "You don't understand how important this is," he told Michael. His employer, Hudson River Trading, uses this kind of profiling all the time, and he said that isn't a trade secret.
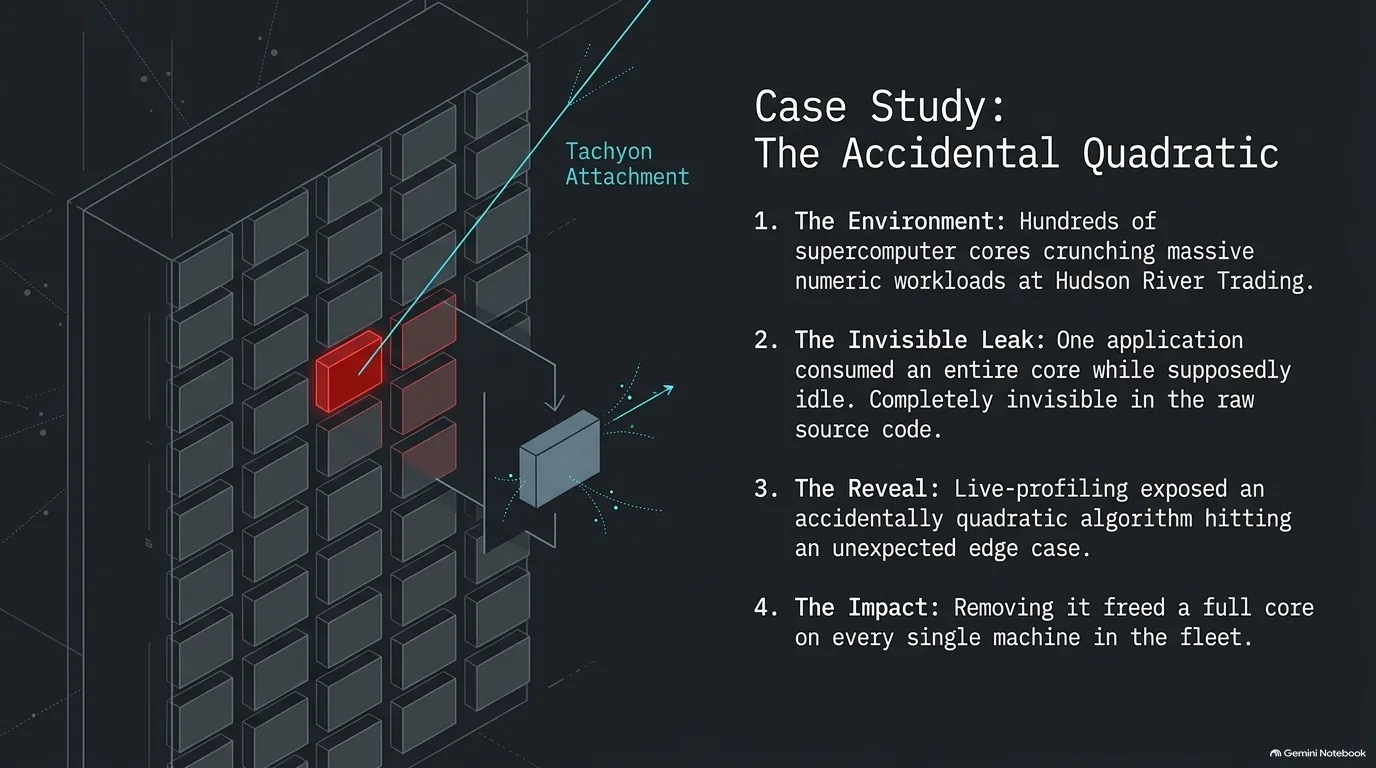
His example came from the very day of the recording. HRT runs huge machines for its data scientists, with hundreds of cores and hundreds of gigabytes of memory. That day they switched on profiling for every program on one of those machines, not just one. It wasn't Tachyon itself but a bigger in-house version of the same idea, and running it at that scale was, in Pablo's words, ridiculously complicated.
The live data showed something odd right away. One application was using an entire core when it should have been doing nothing. In a specific case that turned out to happen a lot, though nobody expected it to, one of its algorithms was accidentally quadratic. Reading the code, no one would ever have spotted it. In the profile, it was obvious. They removed it and freed a core on every single machine of their supercomputer - a huge amount of money saved.
That's why Pablo calls this data the best thing you can get: it tells you exactly what to change. "It's almost cheating." His advice is blunt. Grab Tachyon, attach it to your application, fix what it shows you, and your manager will be happy. Attach it to other people's programs, too. Just do it, László added, before everyone knows the secret. (Michael promised to delete the episode really soon to keep it safe.)
And you don't need HRT's setup to try any of this. Tachyon just comes with Python 3.15.
“If I show you the code, no person on the planet will see it. It is so ridiculously complicated to see. But we could see it as clear as day on the data.”
Pablo Galindo Salgado
Faster CPython, the JIT and free threading: why profiling matters more now
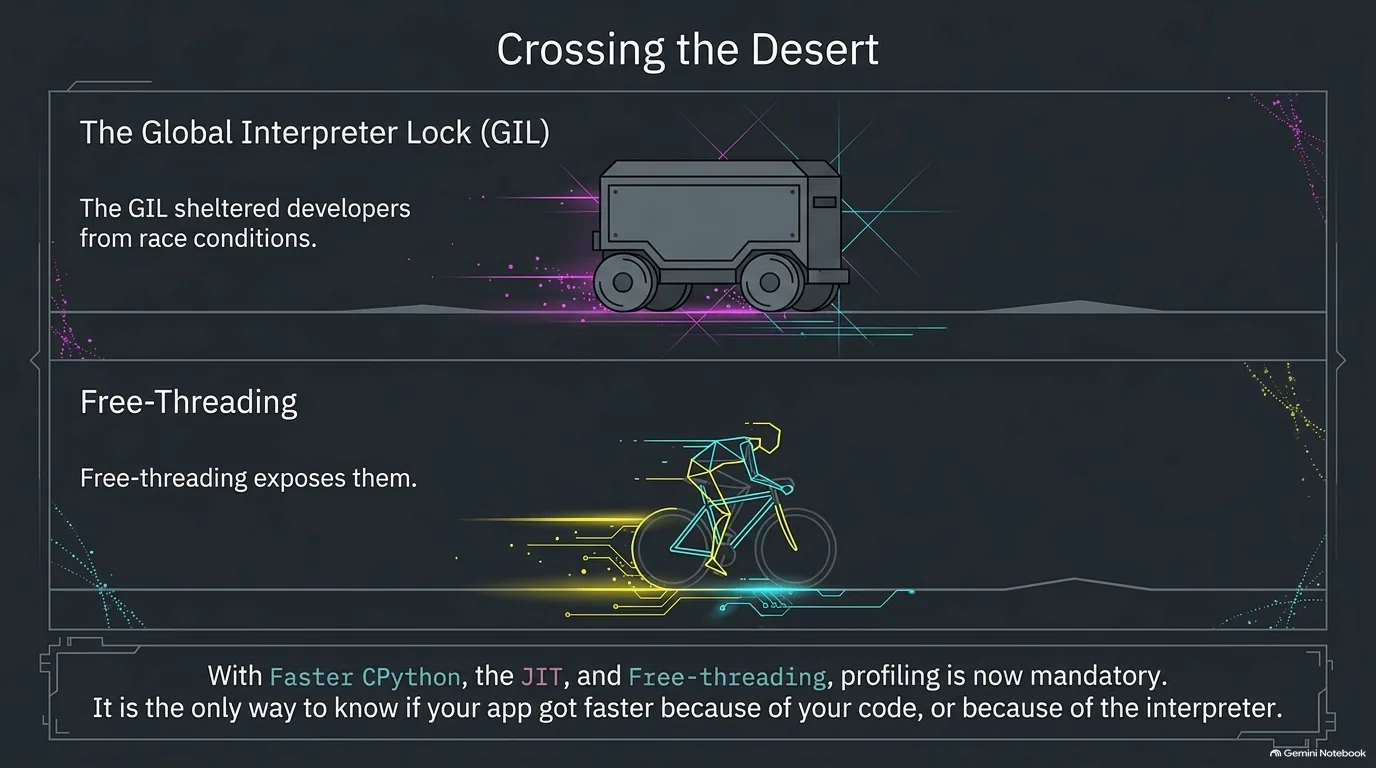
The Faster CPython effort has been through some organizational turbulence, with Microsoft pulling people off the project. Was it a success anyway? Michael calls it a huge one, and Pablo agrees: compare 3.9 or 3.10 with today's Python and it's obvious. The team has simply run out of obvious things to optimize - and obvious, Pablo notes, never meant easy. What's left are big pieces of software like the JIT that take PEPs and years, and they don't necessarily play well with free threading.
László remembers the release that delivered a 30 to 40% speedup basically for free. You normally have to convince teams to upgrade, and that carrot made it easy. He has a lot of faith in the JIT, and he thinks free threading may bring bigger wins sooner for some workloads.
Free threading is also where the worry is. Michael is excited about it, but many library authors have never thought deeply about race conditions, because the GIL kept things effectively single-threaded. He expects bug reports, then locks, then deadlocks, in a couple of waves of growing pains. Pablo's view is that Python developers haven't really been exposed to how hard threads are. Free-threaded code may hit bugs in the interpreter or in packages, and it doesn't scale linearly, because the checks that keep threads from crashing cost something. Not even Tachyon is the tool for that particular problem.
Michael's picture for it: you've been crossing the desert in a car, and now you're doing it on a bicycle. People don't know how nice the car was, Pablo adds, until they're out of it.
So where does profiling come in? If your app got faster, why? You can't tell whether to thank Python 3.15 or a faster NumPy without measuring.
How often Python ships is its own question. Should there be a release every six or three months? Pablo would do rolling releases if he could, but CPython is too big and too many people depend on it. One year is already at the edge of what the core team can responsibly stabilize. A new garbage collector had to be reverted in 3.13 and again in 3.14, because its memory impact only showed up once people used it.
Upgrades can still bite. Only one Python upgrade has ever broken Michael's apps: a database library deep in his stack still used the removed @asyncio.coroutine decorator. With a big enough codebase, Pablo says, you hit those all the time. A new Python forces a new NumPy or pandas, and suddenly a simulation's floating point results are slightly off. The good news is that the core team now works with NumPy and pandas so their wheels are ready on release day, which wasn't true in the 3.8 era.
“Is this because Python 3.15 is going to be faster or is it because NumPy is faster? Like, how do you know? Well, you need to use one of these tools, right?”
Pablo Galindo Salgado
Cronon: profiling Python, C extensions and the kernel together
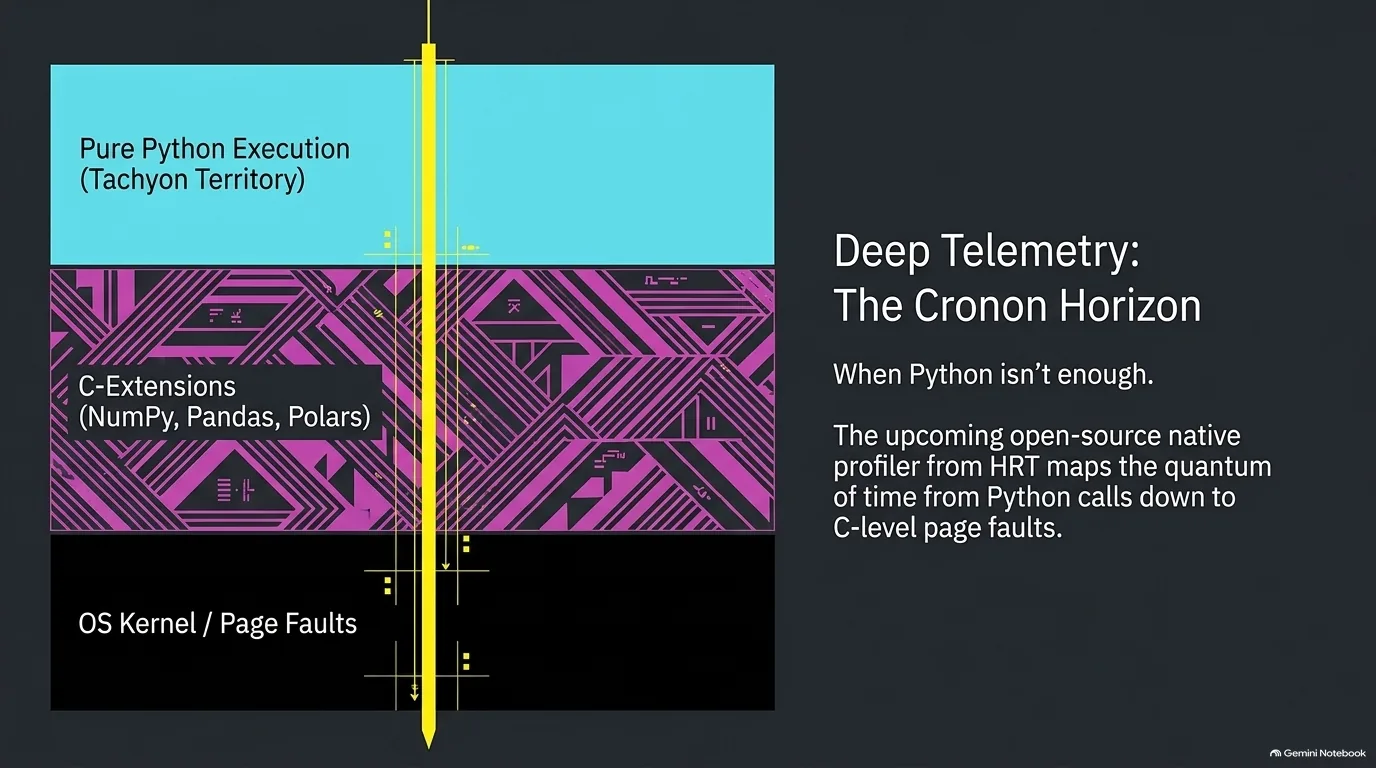
Tachyon has one real limit: it's a Python profiler. If your program spends its time in C code like NumPy, pandas, Polars or CUDA, Tachyon can tell you which Python function made the call, but nothing about what happens inside.
Do you care what happens in the guts of NumPy? Usually not. But sometimes you have to go there to find out why your application is slow. A C profiler has the mirror-image problem. It sees CPython's internals but not your Python names, so instead of the function you wrote, it reports something like _PyEval_EvalFrameDefault. That isn't useful either.
Why not build both into Python? Complexity. By Pablo's estimate, C profiling is about 10 times harder than Python profiling, and doing both at once is a million times harder. The core team didn't want to hand that much hard-to-maintain code to core developers, so it stays out of the standard library.
That gap is where Pablo's last topic of the episode comes in, one he admitted was a bit selfish. He's spent much of the past year at Hudson River Trading building Cronon, which he describes as Tachyon's big brother. The name continues the physics theme: if you quantize time, the particle of time is called a chronon. According to Pablo, it covers what Tachyon leaves out:
- Multiple Python versions. It profiles 3.12 through 3.15, not only the version it runs on.
- Python, C and kernel code in one stack. You can follow a Python function into NumPy, see it create arrays, and see one of those arrays trigger a page fault while the kernel looks for memory.
- Streaming. You can keep it running 24/7 and watch a flame graph change live on a Grafana dashboard, without attaching.
- macOS and Linux.
It's been in use across the company for nine months, with what Pablo called "extreme success." It will be open source in a month or two, he said. That's the context for his earlier aside that Tachyon's title as the fastest Python profiler might not last long.
“When you want to do C profiles, it's like 10 times harder. And then when you want to do both at the same time, it's a million times harder.”
Pablo Galindo Salgado
Install Python 3.15, attach Tachyon and stop guessing
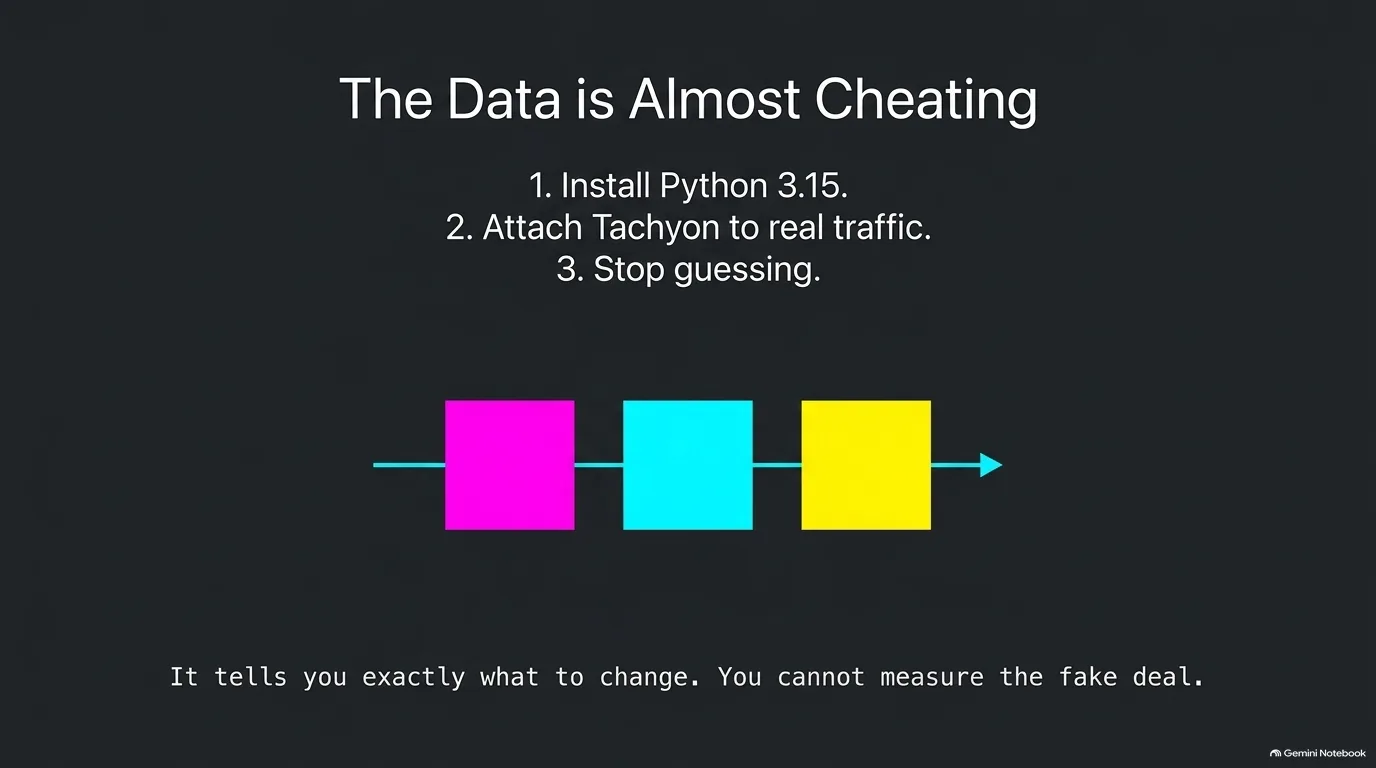
Remember Michael's 6,000 lines of math that weren't slow at all? The same idea runs through every topic in this guide: the thing you're sure is slow usually isn't, and the only way to know is to measure.
For most of Python's history, measuring meant a trade-off. A tracing profiler slowed your program down and distorted what it measured. A third-party sampling profiler had to reverse engineer the interpreter and could break with the next release. Tachyon changes both halves. It reads a running process from the outside at close to no cost, and it lives inside CPython, so the core team is on the hook for keeping it working.
So what should you do with all this? Three steps:
- Install Python 3.15. Tachyon profiles 3.15 processes, and it ships with the interpreter, so there's nothing else to install.
- Attach it to something real. Live traffic shows you things a lab never will. Sample at 100 to 1,000 Hz, attach for a bunch of seconds and detach.
- Look at the data. Pablo called it "almost cheating," because it tells you what to change.
You don't need to be an expert to start. By default, Tachyon just prints the functions where your program spends its time. If you need more, it's there: flame graphs, heat maps, async-aware views, and the CPU, GIL and exception filters.
There's more than one episode can hold - enough, Pablo said, for a second podcast. The guests' PyCon US 2026 talk is a longer tour. László remembers panicking while making the slides for it, wondering how they'd fit all of it into half an hour.
You probably won't free a core on every machine in a supercomputer, like Pablo's team did. You might just find out, like Michael, that you needed a set instead of a list.
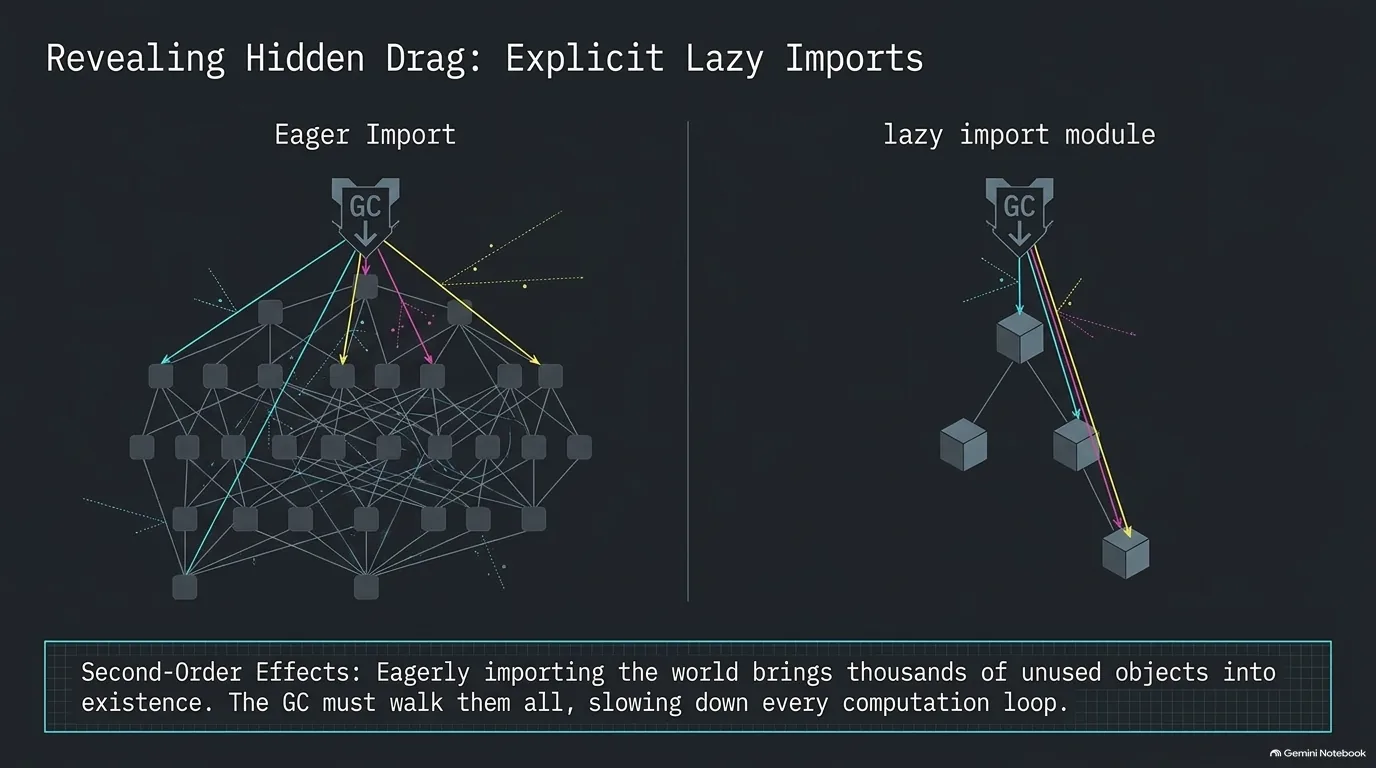
If you want to go deeper on the ideas underneath the profiler, Talk Python Training's Python Memory Management and Tips covers reference counting and the garbage collector behind Pablo's lazy imports argument. Async Techniques and Examples in Python covers the event loop, threads and the GIL that Tachyon's async and GIL modes are built to inspect.
“You never know how your application is really going to behave or what is slow until you measure the real deal. You cannot measure the fake deal.”
Pablo Galindo Salgado