Understanding Pandas visually with PandasTutor


Episode Deep Dive
Guests Introduction and Background
Sam Lau is a PhD student at UC San Diego, advised by Philip Guo, with a research focus on human-computer interaction (HCI), specifically how people use computers to teach and learn programming and data science. Drawing on his teaching experiences, Sam co-created PandasTutor (along with Philip Guo) to help students and developers visualize step-by-step transformations of their data in Python’s Pandas library.
What to Know If You're New to Python
If you’re just getting started and want to understand this episode fully, make sure you are comfortable writing and running simple Python code and can import libraries like pandas. Understanding basic data structures (lists, dictionaries) and how they might show up in data science is helpful too. If you’ve never worked with Pandas before, just know that it’s a key library in Python for data manipulation, letting you filter, group, and reshape tabular data. Mastering Pandas is often a foundational skill for data science in Python.
Key Points and Takeaways
- Visualizing Pandas Transformations with PandasTutor
PandasTutor (https://pandastutor.com) is a web-based tool that reveals what happens behind each line of your Pandas code by showing intermediate data transformations step by step. It visually depicts how rows move, group, and aggregate so you can see exactly how filters, sorts, and group operations shape your data.
- Links and Tools:
- PandasTutor
- PythonTutor (a related project by Philip Guo)
- Links and Tools:
- Filtering and Sorting in Pandas
One of the simplest yet most common data-wrangling tasks is filtering rows and sorting columns. PandasTutor draws arrows between rows to show which rows survive a filter (e.g.,
df[df.size == "medium"]) and highlights the exact column used for sorting. This helps clarify how seemingly straightforward operations can lead to confusion when the data frame is large or intermediate steps are hidden in the code.- Links and Tools:
- Deeper Understanding of GroupBy
Grouping data and then running aggregations (
sum,median,max, etc.) is crucial but often confuses learners. PandasTutor color-codes groups and draws multiple arrows converging into a single row for each group. This clarity is especially useful for novices trying to figure out why rows disappear or how their data is partitioned.- Links and Tools:
- Use Cases in Teaching and Presentations Sam described using PandasTutor’s visual approach in the classroom. Instead of manually commenting out lines or juggling multiple data frame printouts, an instructor can show transformations side by side, making it much easier for students to see how each step works. Educators can embed the generated diagrams into slides or share them via links.
- Beyond Beginners: Debugging and Stack Overflow
While PandasTutor is excellent for newcomers, experienced developers can also paste complex Pandas snippets from Stack Overflow (or their own code) into PandasTutor. This “visual debugger” clarifies the flow and transformations, helping you verify the final data structure matches expectations.
- Potential Future Feature:
- A browser extension or bookmarklet to auto-visualize Pandas code snippets right on Stack Overflow
- Potential Future Feature:
- Expansion to Other Data Tools
The tool’s design can apply to other data frameworks, potentially including joins, pivots, or even R’s Tidyverse. Sam mentioned Tidy Data Tutor, a sibling project for the R ecosystem. With enough interest and development effort, concepts like Dask or Spark might see similar approaches to illustrating distributed data transformations.
- Links and Tools:
- Tidy Data Tutor (R variant by Sam’s colleague)
- Links and Tools:
- Potential Integrations: JupyterLab or Offline Mode
The discussion touched on embedding PandasTutor as a JupyterLab extension, so users can visualize their steps inline. Another direction might be using WebAssembly or Pyodide to sidestep sandbox restrictions, letting you work with real or larger data sets offline without server constraints.
- Links and Tools:
- Dealing with Data Imports and Code Sandboxing Since PandasTutor runs your code in a Docker container with limited internet access, a typical Pandas CSV import from a URL might not work. Instead, you can embed short CSV data as a Python multiline string. This design keeps the tool secure but can require a little extra setup to show your own data transformations.
- Sam’s Ongoing Work and Future Plans Sam is currently finishing his PhD and working on a data science book (tentatively titled “Learning Data Science”). PandasTutor may expand to handle a broader range of Pandas operations—like joins and pivots—and potentially be open-sourced once it’s ready for wider community collaboration.
- Insights on Human-Computer Interaction in Data Education Sam’s research reveals how vital it is for students to see both code and data transformations at the same time. Interactive, visual step-by-step breakdowns can reduce friction in understanding. This HCI-centric approach underscores that tools like PandasTutor don’t just accelerate coding but also deepen learning and confidence.
Interesting Quotes and Stories
- Sam on teaching data transformations: “A lot of times, when we’re teaching data science, we have multiple lines of code that produce only the final output. Students ask, ‘What happened in the middle?’ and we’d be commenting code in and out. PandasTutor came directly from wanting a tool that shows each stage visually.”
- On groupby confusion: “Groupby is especially tricky because rows just vanish into those groups. PandasTutor’s color coding and arrows let you see exactly where they went and how they’re aggregated.”
Key Definitions and Terms
- DataFrame: A two-dimensional labeled data structure commonly used in Pandas.
- Filtering: Selecting rows of data based on one or more conditions, e.g.,
df[df["column"] == value]. - Sorting: Rearranging rows in ascending or descending order according to a specified column.
- GroupBy: Splitting a DataFrame into groups based on some criteria, applying a function to each group independently, and combining the results.
- Aggregation: Summarizing data in groups by a specific operation like sum, mean, median, or max.
Learning Resources
Below are a few options to deepen your knowledge of Python, Pandas, and data manipulation concepts:
- Python for Absolute Beginners: A gentle introduction if you’re brand-new to programming in Python.
- Move from Excel to Python with Pandas: Ideal if you know your way around spreadsheets and want to step up to Pandas for more sophisticated data analysis.
Overall Takeaway
PandasTutor highlights the power of visual feedback in data science. Whether you’re a teacher, student, or experienced developer, seeing precisely how rows and columns transform across filters, sorts, and groupby operations can simplify debugging, enhance learning, and enrich your understanding of Pandas. Sam’s HCI-driven perspective reminds us that good tooling isn’t just about speed—it’s also about insight and clarity into what our code really does.
Links from the show
Sam on Twitter: @samlau95
PandasTutor: pandastutor.com
PythonTutor: pythontutor.com
Principles and Techniques of Data Science book: textbook.ds100.org
Watch this episode on YouTube: youtube.com
Episode #358 deep-dive: talkpython.fm/358
Episode transcripts: talkpython.fm
---== Don't be a stranger ==---
YouTube: youtube.com/@talkpython
Bluesky: @talkpython.fm
Mastodon: @talkpython@fosstodon.org
X.com: @talkpython
Michael on Bluesky: @mkennedy.codes
Michael on Mastodon: @mkennedy@fosstodon.org
Michael on X.com: @mkennedy
Episode Transcript
Collapse transcript
00:00 Pandas is a great library that allows you to accomplish a ton of filtering and processing in condensed syntax.
00:06 But how well do you understand what's happening?
00:08 Sam Lau and Philip Guo built a great site to help us visually explore how Pandas is processing your dataset with your specific syntax.
00:17 It's called Pandas Tutor, and Sam is here to tell us all about it.
00:21 This is Talk Python To Me, episode 358, recorded February 28, 2022.
00:27 Welcome to Talk Python To Me, a weekly podcast on Python.
00:44 This is your host, Michael Kennedy.
00:46 Follow me on Twitter where I'm @mkennedy and keep up with the show and listen to past episodes at talkpython.fm.
00:52 And follow the show on Twitter via at Talk Python.
00:55 We've started streaming most of our episodes live on YouTube.
00:58 Subscribe to our YouTube channel over at talkpython.fm/youtube to get notified about upcoming shows and be part of that episode.
01:06 This episode is brought to you by SignalWire and the Stack Overflow podcast.
01:11 Please check out what they're both offering during their segments.
01:14 It really helps support the show.
01:15 Transcripts for this and all of our episodes are brought to you by Assembly AI.
01:20 Do you need a great automatic speech-to-text API?
01:23 Get human-level accuracy in just a few lines of code.
01:25 Visit talkpython.fm/assemblyai.
01:28 Sam, welcome to Talk Python To Me.
01:31 It's great to be back.
01:31 It's good to have you back.
01:33 Previously, you were here with Philip Guel and your research.
01:38 Is he your advisor at UCSD?
01:40 Yeah, Philip's my advisor.
01:41 Philip is a great guy.
01:43 He's been on the show multiple times before.
01:45 And you all were here previously to talk about, you had analyzed an insane number of notebook environments, right?
01:54 Yeah, something like 60 of them.
01:56 Yeah, like 60.
01:57 So people think of JupyterLab and maybe Google CoLab.
02:01 And then is there another one?
02:02 Maybe 60.
02:03 It's insane, right?
02:04 There's just a long list.
02:05 We have like a giant table in that paper that takes up one whole page and it's a lot going on.
02:10 That was really fun to have you on to talk about that.
02:13 And I suspect that that list is longer, not shorter now.
02:16 Of course, of course.
02:17 It just is growing.
02:19 How about we just do a quick sync up?
02:21 What have you been up to?
02:22 When was that?
02:23 That was about a year, year and a half ago.
02:26 So it's been a while.
02:26 What have you been up to?
02:27 You still over at UCSD?
02:29 Yeah, so I'm still at UCSD.
02:31 UCSD being University of California, San Diego, for those who are not hanging out on the West
02:36 Coast, the U.S. and are familiar with all the UC acronyms.
02:39 Yeah, UC San Diego.
02:40 Here in sunny San Diego.
02:41 I'm doing my PhD in cognitive science.
02:45 But what that really means for me is most of my research is in a field called human-computer
02:49 interaction, which is the way I describe it is more or less the study of user interfaces,
02:54 how people interact with computers.
02:57 And for me specifically, how people interact, how people use computers to teach and learn
03:02 programming in data science.
03:03 Yeah, that sounds super fun.
03:05 There's just so many more interfaces these days.
03:08 You know, human-computer interfaces used to be just like, well, how do you use Windows?
03:12 Yeah.
03:13 Or something like that, right?
03:14 Well, even before that, it was like, how do you type stuff into a terminal, right?
03:18 Before we even had like Windows.
03:19 And then people from like the community was like, you know, like Windows would be good.
03:23 And then they were like, maybe touchscreens will be good.
03:25 So now we have all these cool input, ways to input like commands into a computer and make
03:30 use of that.
03:30 Yeah, absolutely.
03:31 And so it seems like you and Philip are somewhat focused on how developers interact with computers.
03:38 Is that fair to say?
03:39 We kind of do a mix.
03:40 So Philip, I think, has done a lot of developer-oriented work maybe like in the last five years or 10 years
03:49 or so.
03:49 For me specifically, I'm more interested in like how students and instructors use computers.
03:55 Okay.
03:56 So like what people, how people use, like create lecture slides using like screenshots of like their notebook environments
04:03 and how people like put code in their slides and use code to teach while also like, while also talking over at the same time.
04:10 Sure.
04:11 Well, and notebooks are all about communicating computational ideas, either being science or developer or data science, right?
04:18 Yeah.
04:18 Yeah, for sure.
04:19 And then nowadays we see a lot of notebooks being used in the classroom as well.
04:23 So instructors will not only have lecture slides, but a lot of instructors will like flip back and forth between lecture slides and a computational notebook like Jupyter.
04:32 So they'll have lecture slides for a few minutes and then they'll do some live coding in front of students for another few minutes and they'll switch back and forth.
04:39 So we're seeing a lot of that sort of use case in the classroom.
04:43 And that's where, like, that's the sort of thing that I'm really interested in because here we have people doing something visual, doing something verbal, but also now doing, working with code and having students like see code in the classroom.
04:54 I think it must be such an advantage for students these days.
04:57 I remember when I was in school, it was either the instructor would be writing something either on the blackboard or on like one of those overlay things with a pen and with a light that literally went through it.
05:09 Or, you know, you would just get a book or something.
05:11 But now if you want to say, well, look how these forces in physics come together or look how these chemical bonds are formed.
05:17 You could see them actually, you could see actual animation that you could try new ideas.
05:21 And it's just, it's opened up so much exploration, I think.
05:24 Yeah, I think it's really cool.
05:25 And, you know, I don't know about you, but I would definitely prefer to write code in the computer rather than writing code in the overhead slide.
05:32 Oh my goodness.
05:33 Can not even imagine doing it that way.
05:37 So for sure, for sure.
05:38 All right.
05:39 Speaking of code, let's talk about your project.
05:42 So you have this project called Pandas Tutor.
05:45 Yeah, that's right.
05:46 And this is a little bit of a next generation data science thing followed on from Python Tutor, right?
05:52 I see some similarities in the website and stuff like that.
05:55 Yeah, yeah.
05:57 So Pandas Tutor, the website is similar to the Python Tutor website because Philip used like his old style sheet for both of them.
06:05 Sure.
06:05 When we were getting this out the door, we were, at the time, we were like very focused on squashing bugs and like adding new features.
06:13 And then the website was like, oh, okay, like we got to launch this thing.
06:16 We need something to put on.
06:18 So Philip was like, okay, let me copy my styles.
06:20 Yeah.
06:20 Well, his styles look good.
06:22 So I think it's, there's nothing wrong with that.
06:24 It's very nice visualizations and interactives.
06:27 So what is this?
06:29 Why would people be interested in Pandas Tutor?
06:31 It might sound like it's a series of video courses on Pandas or something, but that's not at all what it is, right?
06:37 Tell people what this is.
06:38 Yeah.
06:39 So Pandas Tutor is a little website tool where you can paste in some Python Pandas code.
06:46 So Python code that works with data frames.
06:48 And what the tool will do is it'll take your code and break it down step by step.
06:53 It'll draw a little diagram for you at every step of your code.
06:56 So I have a little example on the website, but the example on the website basically shows that if you have a few lines of Pandas code, when you run those lines in a Jupyter notebook, let's say, all you get when you run the cell, all you get when you run the code is a final output.
07:11 So even if there are like four steps in the recipe, all you get is the finished cake and you don't really get to see the middle steps that happen.
07:18 And so often, you know, that's what you do.
07:20 Like I'm going to transform this data frame with these multiple operations to get a new data frame.
07:25 That's the destination I want to be at, right?
07:27 Totally.
07:27 Totally.
07:28 Yeah.
07:28 And it happens all the time in real practice for data analysis.
07:32 And it also happens a lot in the classroom.
07:34 So a lot of times when I'm teaching in data science, a little piece of data science, I'll write a few lines of code.
07:40 But the problem is like students ask me like, oh, what happened?
07:43 Like there's a lot going on.
07:44 Like, can you show me like this step or like step three in the code or step four?
07:47 And I have to like manually comment out lines of code and display those data frames to students.
07:52 So this tool kind of emerged from that use case.
07:55 Yeah, absolutely.
07:56 And it's totally reasonable that you would comment out those lines.
07:59 But it's also more difficult still to see the transformation, right?
08:04 So if I say, well, what happens if I don't do, say, a group by, but I just get the previous result?
08:09 Well, then, you know, you kind of, how do you put that side by side with the other, the next step, right?
08:14 There's not a great mechanism for saying put these side by side and see the changes without like lots of scrolling and back and forth and stuff.
08:22 Totally.
08:22 Totally.
08:22 Yeah.
08:23 Yeah.
08:23 Yeah.
08:23 So it's something, it's a use case that came directly out of our experiences teaching data science, where a lot of times when we teach, we're like, okay, in the top cell of a notebook, we'll like display dogs.
08:35 And then the cell below it, we'll do some stuff with the data frame, like dogs dot sort values.
08:40 And then we have to say, okay, students, like look at the top data frame and look at the bottom one, and then compare those two and like stare really hard at it and try to figure out what happened between the two, between the two data frames to understand it.
08:53 So whereas with Pandas Tutor, what I could do instead is put the code, just paste the code into Pandas Tutor.
09:00 It'll display the two data frames side by side and draw some arrows between the two data frames or add some coloring so that I can see, oh, okay, the rows were sorted.
09:08 I don't have to ask people to like stare really hard and imagine the rows moving from place to place.
09:13 And before we get too far into this episode, I do want to just point out to people like this is a really visual tool, which is its massive advantage.
09:22 But that also puts Sam and me at a disadvantage for discussing it during this audio, mostly audio presentation.
09:30 So you might consider checking out also the YouTube stream and flipping around there or just open up PandasTutor.com and play around with it yourself.
09:38 Like it's all about just a live example.
09:39 So with that said, I want to dive into a few things.
09:42 There's going to be an example here that we're going to cover a lot.
09:46 And it's an example using a Pandas data frame called dogs.
09:49 And the dogs are like the breed, which would be German Shepherd or Terrier or whatever.
09:55 And then type is a herding dog or a hound dog or a toy dog.
09:58 I love the toy dog idea.
10:00 And then there's a filtering statement where you say dogs bracket, dog size, equal, equal, medium.
10:06 That's a standard Pandas like, let's do this filter type of wear clause.
10:10 And then there's a sort where you sort by the type of dog, you know, the herding or hound dog or working dog, whatever.
10:17 And then you do a group by on the type.
10:21 So show me all the non-sporting dogs, all the sporting dogs and so on.
10:25 Yeah.
10:26 Yeah, that's right.
10:27 We'll be using this data quite a bit.
10:29 Before we get into analyzing Pandas, I guess one thing I was wondering is, it's super focused on Pandas and Pandas data frames.
10:38 Did you consider making it for other tools like a NumPy one or a TensorFlow one?
10:45 Or like why Pandas specifically out of the data science space?
10:48 It's a great question.
10:49 Pandas happens to be like the de facto tool for working with data tables in Pandas.
10:55 I mean, they can bring data tables in Python.
10:57 And it's taught a lot in introductory courses specifically.
11:00 So a lot of intro to data science courses, when they teach students how to work with data tables, they'll also teach students how they work with Pandas.
11:09 We chose to focus on Pandas because of like those two aspects.
11:12 So one, it's like a common standard package that a lot of people use in practice.
11:17 And it's also a package that people, a lot of people learn when they're learning data science for the first time.
11:23 They'll learn Pandas as one of the first stepping stones to learning how to do data analysis.
11:28 Now, there is another version of this tool for the R data, like R tidyverse world.
11:34 It's called a tidy data tutor instead of Pandas tutor.
11:37 And it was made by one of my lab mates and Phillip as well.
11:40 So we kind of, the three of us kind of worked together.
11:43 I worked on the Pandas side and then my lab mate worked on the R tidyverse side.
11:48 Sure.
11:48 Okay.
11:48 Yeah, that's cool that it depends, you know, regardless of which side of data science you're on, you can grab this and run with it.
11:54 Yeah.
11:55 And as for other tools, I think the approach that the tool uses to analyze code could be applied to all sorts of other tools, including tools like TensorFlow.
12:05 And that's probably one of the exciting things for me is that like, this for me is like a stepping stone towards like all sorts of visual tools for learning Python packages or other data science specific things that otherwise are difficult to understand.
12:17 Or like things that you would normally draw a picture to understand normally.
12:21 I can imagine a tool like this drawing a picture for you or helping you like when you're explaining your code to someone else.
12:26 When I first learned about this, Brian Okken and Leah Cole and I spoke about it over on the Python Bytes podcast.
12:33 And Leah made a really interesting point when she saw this.
12:37 My first impression is, okay, this is a great way to teach students who are getting into data science.
12:42 And it sounds like that's a very solid use case.
12:45 But Leah said, hey, this would be really good if you just like went to Stack Overflow or you picked up some new code and you're like, what does this do?
12:53 This is like a complicated pandas expression.
12:56 Let me throw it in here and you could visualize that.
12:58 So I want to sort of put that out there for people to think about, well, if they're not learning data science right now, they're probably still encountering algorithms and data sets that are new to them.
13:09 And that might be useful as well.
13:10 What do you think?
13:11 Yeah, I totally agree with that.
13:12 And actually, one of the ideas that Philippa and I had was to do a little bookmarklet where if you put the bookmarklet in your browser bookmarks bar and then you're on Stack Overflow and you click that button, we could even show you those diagrams that pandas created in line.
13:30 If you click it online on a Stack Overflow website or let's say the pandas documentation.
13:35 I've certainly run into the problem where I'm trying to like Google, like, how do I, let's say, unpivot a data frame and then I pull up the first Stack Overflow result and then it works, but it's like five lines of complicated machinery.
13:49 And I'm trying to figure out what's going on.
13:51 And I have to like, like kind of walk through it step by step myself to make sure it's not messing up my data in some way.
13:56 And so I can imagine like a tool like this, if you could display the visualizations in line and just put it in Stack Overflow's website itself on the user side, then that could be like a nice way to make use of the visualizations in real practice.
14:09 That would be really cool.
14:10 Just install a browser helper that like every time it detects a panda statement, it just puts a little.
14:17 Yeah, yeah.
14:17 Like a little Chrome extension.
14:18 That would be super neat.
14:19 I would use that.
14:20 Yeah, for sure.
14:21 So let's click on start visualizing your Python code now.
14:25 Now I'll pull this up and run.
14:27 And this, what happens for those of you who are not familiar with Python Tutor and Pandas Tutor is it actually executes, you put a block of code in here and it actually executes it in a container or something like that, right?
14:39 Yeah, that's right.
14:40 So it'll run your code in a Docker container on one of our servers.
14:43 Nice.
14:43 You don't have to just explore other people's code, right?
14:46 You can put whatever you want in here.
14:48 Now, the first thing that I think about when I think about data frames is data.
14:53 Obviously, you've got to get some data in here.
14:55 And as we were talking about this Chrome extension, one of the challenges for me is, well, here's a cool little code snippet, but it has to have the proper data frame data backing it before it really means anything, right?
15:08 Yeah, that's right.
15:08 It's a challenge.
15:10 It is.
15:10 So how do you get data in here?
15:12 What are the options for getting data in here?
15:13 Okay.
15:14 So the one challenge about hosting a tool that runs code for other people is that it's a little bit, you run into issues when you let the tool like also have internet access.
15:25 Because then people will start mining Bitcoins using X2.
15:28 Yes, exactly.
15:28 And arbitrary code on the internet, how could it go wrong?
15:33 I mean, I know with a Docker container, it's not going to harm you or the other things most likely, unless there's an exploit fully in Docker.
15:41 But they're going to exploit your computational resources and things like that, right?
15:44 That's right.
15:45 That's right.
15:45 Yeah.
15:46 Yeah.
15:46 Okay.
15:46 So you probably don't have full just root access to do whatever you feel like here.
15:51 Yeah.
15:51 So the tool, it cuts off internet access for your code and it also imposes like a few memory limits.
15:58 So I don't think you can write, you might be able to read or write to disk temporarily.
16:03 I don't quite remember the details of that, but I do know that it does restrict internet access.
16:08 So a lot of things like one common way that we'll get data sets in class is we'll do pandas.readcsv and put in a URL.
16:15 Yeah.
16:16 Of a CSV file.
16:17 And unfortunately, that doesn't work for the tool.
16:19 So the way that we're getting around this right now is in the examples that we have for pandas tutor on the website, we have like inline CSVs.
16:28 So we put a snippet of a CSV file as a Python string, and then we can read that string into pandas as if it was a CSV file.
16:36 Yeah.
16:36 Yeah.
16:37 So you just drop it in as part of the code as a, what's that, a literal string, the triple quotes that'll go multiline.
16:44 So you just drop it in the middle of that, right?
16:46 Yeah.
16:47 Yeah.
16:47 And it's not, I definitely don't think it's an ideal solution.
16:50 What I would like, like one stepping stone to like a future solution would be to include some example data sets with Python, with pandas too, so people can load in directly.
17:00 That's a good idea.
17:01 The R version of this tool has some built-in data sets because of R's like built-in packages.
17:06 So R has like, I think it comes with default, like the car, like the cars data set, maybe like some flowers data sets.
17:13 So you can load those in directly.
17:15 And that makes the R version of this a little bit more convenient.
17:18 So we're thinking about ways of loading in data right now, but in terms of being able to load in arbitrary data, the only real option right now is to go into your CSV file and copy and paste out a few lines of it into the tool directly.
17:34 This portion of Talk Python To Me is brought to you by SignalWire.
17:37 Let's kick this off with a question.
17:39 Do you need to add multi-party video calls to your website or app?
17:42 I'm talking about live video conference rooms that host 500 active participants, run in the browser and work within your existing stack, and even support 1080p without devouring the bandwidth and CPU on your users' devices.
17:55 SignalWire offers the APIs, the SDKs, and edge networks around the world for building the realest of real-time voice and video communication apps with less than 50 milliseconds of latency.
18:05 Their core products use WebSockets to deliver 300% lower latency than APIs built on REST, making them ideal for apps where every millisecond of responsiveness makes a difference.
18:16 Now, you may wonder how they get 500 active participants in a browser-based app.
18:20 Most current approaches use a limited but more economical approach called SFU, or Selective Forwarding Units, which leaves the work of mixing and decoding all those video and audio streams of every participant to each user's device.
18:32 Browser-based apps built on SFU struggle to support more than 20 interactive participants.
18:38 So SignalWire mixes all the video and audio feeds on the server and distributes a single unified stream back to every participant.
18:45 So you can build things like live streaming fitness studios where instructors demonstrate every move from multiple angles, or even live shopping apps that highlight the charisma of the presenter and the charisma of the products they're pitching at the same time.
18:58 SignalWire comes from the team behind FreeSwitch, the open-source telecom infrastructure toolkit used by Amazon, Zoom, and tens of thousands of more to build mass-scale telecom products.
19:09 So sign up for your free account at talkpython.fm/signalwire, and be sure to mention talkpython to me to receive an extra 5,000 video minutes.
19:18 That's talkpython.fm/signalwire, and mention talkpython to me for all those credits.
19:24 It's not a huge problem because the goal here is not to execute and get results from it.
19:31 It's like, what would it look like if I did this?
19:34 Yeah, that's right.
19:35 So it's not really about visualizing gigabytes of data frame transformations because in those cases, we're going to draw a bajillion arrows, and it's really hard to see what's exactly happening between the two data frames.
19:48 Exactly.
19:48 From an understanding perspective, it might be worse, right?
19:51 Because it's like, as people will see as they explore PanasTutor.com, like, it's putting lines and little interactive widgets all over the place to see how the data flows.
19:59 And if you've got too much, then it's just lines everywhere.
20:02 Yeah, yeah.
20:03 Yeah, cool.
20:03 All right.
20:04 So we've got this data, which we already talked about a little bit, the dogs.
20:07 And so we've got like a Labrador Retriever, which is a sporting dog.
20:11 That is, it lives to 12 years.
20:13 That's right.
20:15 It's medium-sized, and it's 67 pounds, and so on.
20:18 So that's the kind of data that we're working with.
20:20 You jam that into an in-memory CSV string, use io.string.io to treat it like a file stream, and tell Pandas to read CSV it.
20:29 Okay.
20:29 So then you want to know, basically, let me go to the finalists.
20:33 You want to know, given a type of dog, like non-sporting, sporting, working, what is its median longevity in years and its weight, right?
20:42 That's right.
20:42 So that's the kind of question that you're trying to answer, which is kind of incredible that given this data, it's only three lines of Pandas to answer that.
20:50 Yeah, Pandas does a lot behind the scenes.
20:51 Yeah, that's pretty remarkable, actually.
20:54 So what happens when you say visualize this is it takes that same code block that we've been talking about, dogs, dog of size, equal, equal, medium, sort values, group by, median, and so on.
21:06 And you put that on the screen where the parts that are not relevant at the moment are grayed out, and the code that it's actually applying at that step is strong or regular color font.
21:20 That's really clever.
21:21 How do you come up with that idea to say, like, we're going to show the flow through this code by, like, dimming the other parts of the code?
21:28 When we were making this tool, our first cut of this was actually just to show the code that we were running itself.
21:33 Right, so you'd say, like, dog, bracket size, equal, equal, medium, or something like that, right?
21:37 That's exactly right.
21:38 So in the first version of this tool, we did, like, if we're filtering a data frame and then, like, sorting it, we would just show the code for filtering first.
21:46 But we showed all the code for filtering.
21:48 And then when we sort the data frame, then we would show the code for filtering and sorting because that's the snippet of code that we would execute or, like, visualize.
21:57 And it ended up being a little bit, it ended up being, like, less helpful, in our opinion, when we had, like, longer chains, especially.
22:05 Because when you have longer chains, it looks like there's, like, five things running, but really all we're visualizing is the last step.
22:13 So what the solution we kind of came around to was to say, okay, well, we'll just display all the code that we're visualizing, but bold, like, highlight the part that we're visualizing in this step.
22:24 So if there's four steps, then we'll have, like, four little diagram displays, and we'll highlight this, like, the individual steps that we're running at each time.
22:32 Yeah, there's a lot of subtleness in this tool that it takes a, you know, on first glance, you don't see exactly how much it's communicating, but there's a lot of nice touches like that.
22:42 So in this first step, it says we're going to go and filter down our data set from all the different types of dogs, like large dogs, small dogs, and so on, to just look at medium-sized breeds.
22:54 So then we get to the thing that we were talking about, where you've got two data frames, as if you had done just, like, df.head or something, where it puts the top and then, like, a few listings of them.
23:05 That's right.
23:05 But it puts them side by side, right?
23:07 Tell us what's on the screen here.
23:09 Describe this.
23:10 Yeah.
23:10 So on the left, we displayed the original data frame dogs, and then on the right, we displayed the data frame dogs, but with the medium dogs filtered.
23:20 So the right data frame only has medium dogs, and the left data frame has all the dogs in the original data frame.
23:25 Right.
23:26 So that's the filtering that you might first see.
23:28 But then you also have lines, which are pretty cool.
23:30 Yeah.
23:31 Yeah.
23:31 So what we're doing here is we're showing which rows from the original data frame made it into the right data frame.
23:38 So in the original data frame, it looks like rows three, four, you know, three through seven, and a few more other rows made it into the right side.
23:46 And what we're doing is we're drawing arrows to show from the left side which rows got copied over into the right side.
23:52 Yeah.
23:52 So in that filter, you can sort of see them going across, which is fantastic.
23:56 And the other part that's subtle, I guess there's two more, is this looks like a static picture.
24:02 Like, it almost looks like a JPEG or something.
24:03 But then as you move your mouse over, as you hover over a particular row in the original data set, it'll highlight just what happens to that row and where did it end up, either directly or in some kind of aggregation like a sum or something on the right-hand side, right?
24:19 That's right.
24:19 So there's this really cool sort of hovery, like, follow this piece of data along story.
24:24 Yeah, that's right.
24:25 And you can do it on the right side, too.
24:27 So if you hover on the right side, it'll show you the rows that went into that on the left side.
24:31 Okay.
24:31 This is convenient when there's a lot of arrows.
24:33 So this is, like, the main reason why we did this was in some cases, there are a lot of arrows, and you want to just show a few of them.
24:41 And to do that, the easiest way to do that in this tool right now is to highlight moving mouse over a row.
24:46 Yeah.
24:47 That's one subtlety here.
24:48 In this case, it's not super relevant because it's just a filter.
24:51 That's right.
24:51 When you get down to, like, group by and stuff like that, you're like, well, show me everything that went into this row on this group by.
24:57 Like, well, these three.
24:57 That's right.
24:58 That's pretty cool.
24:58 Yeah, yeah.
24:59 So it's especially helpful when you have, like, multiple rows on the left going into a single row on the right or some weird combination of rows that otherwise, like, would be hard to see.
25:09 Yeah, for sure.
25:10 One final thing is we're doing a sort by this comparison, or sorry, filter, by this comparison on the size column of the data frame.
25:19 So dog, bracket size, equal, equal, medium.
25:22 And on both of these, you've got, like, an outline, a vertical outline on the size.
25:28 So that's another aspect that's really nice to highlight what's going on here, right?
25:32 Yeah, that's right.
25:32 So we're drawing a box from the size column.
25:35 That's meant to show the user, like, what column we're using for filtering.
25:39 Yeah.
25:39 There's actually one more thing here I wanted to point out, which is that if you display this data frame in a Jupyter notebook, you might not actually see any medium-sized dogs because they're hidden in, like, the middle rows of this data frame.
25:52 Yeah.
25:52 And so by default, Pandas displays, like, a few rows from the top and the bottom of a data frame.
25:57 But sometimes when you're, like, filtering, the rows that you're filtering only come from the middle of the data frame, which are hidden by default.
26:04 So you have to kind of, like, really, like, scrub through the data frame yourself in a Jupyter notebook to see that there are medium dogs in the first place.
26:11 So one thing we're doing with this tool is whenever we draw an arrow, we make sure that the rows on the left are visible to the user.
26:18 So we'll, like, selectively hide and show rows to make sure that you can always see the rows that we're making use of.
26:24 Right.
26:24 The most important ones are the ones that are included.
26:27 So let's include some of them, right?
26:29 That's right.
26:29 That's right.
26:30 Yeah.
26:30 Yeah.
26:30 You've got these little subtle one more, four more in this section, and so on.
26:35 So that's pretty neat.
26:36 All right.
26:36 So, so far, we're step one.
26:39 We've taken all the different types of dogs, and we're now down to a data frame of just medium-sized dogs.
26:44 The next thing to do was, what, sort them, right?
26:47 Yeah, that's right.
26:47 Okay.
26:48 So maybe tell us about this step here.
26:49 Yeah.
26:50 So in this step, we're sorting the rows by the type column.
26:53 So again, we're going to highlight or draw a box from the type column for the input and the output to show the user, this is the column we're using for this operation.
27:01 And here we're drawing arrows, and the arrows kind of crisscrossing this diagram because some of the rows go to the top of the data frame, and some of the rows go to the bottom of the data frame after we sort them.
27:11 Yeah.
27:12 As you would expect.
27:13 But you can see, after the sort, here's where everything sort of started and ended up.
27:17 So that's pretty straightforward, I would say.
27:19 And then you have a group by one.
27:21 Tell us how you visualize the group by stuff because that's pretty interesting to think about.
27:26 How do you represent the two-dimensional data, but then additionally the groups?
27:30 Yeah, yeah.
27:31 So when we group data, what we do visually is we use the same color to highlight the backgrounds of each row within a group.
27:40 So in this example, all the non-sporting dogs will get highlighted blue.
27:44 All the sporting dogs get highlighted light green.
27:46 And then all the working dogs get highlighted red.
27:48 So you can see visually how the rows are put together in groups by pandas.
27:53 Yeah, fantastic.
27:54 And then finally, simple but also very cool visualization is you just go to that data frame.
28:01 You say, give us the median of that.
28:03 And I guess, I don't know pandas super well, but I guess if you just say dot median, that'll just give you the median of all the columns that are numerical.
28:10 Is that what happens?
28:11 That's right.
28:12 So it'll give you the median for all the dog longevities and the median for all the dog weights.
28:16 Which is the two numerical columns.
28:19 Yep.
28:19 Okay.
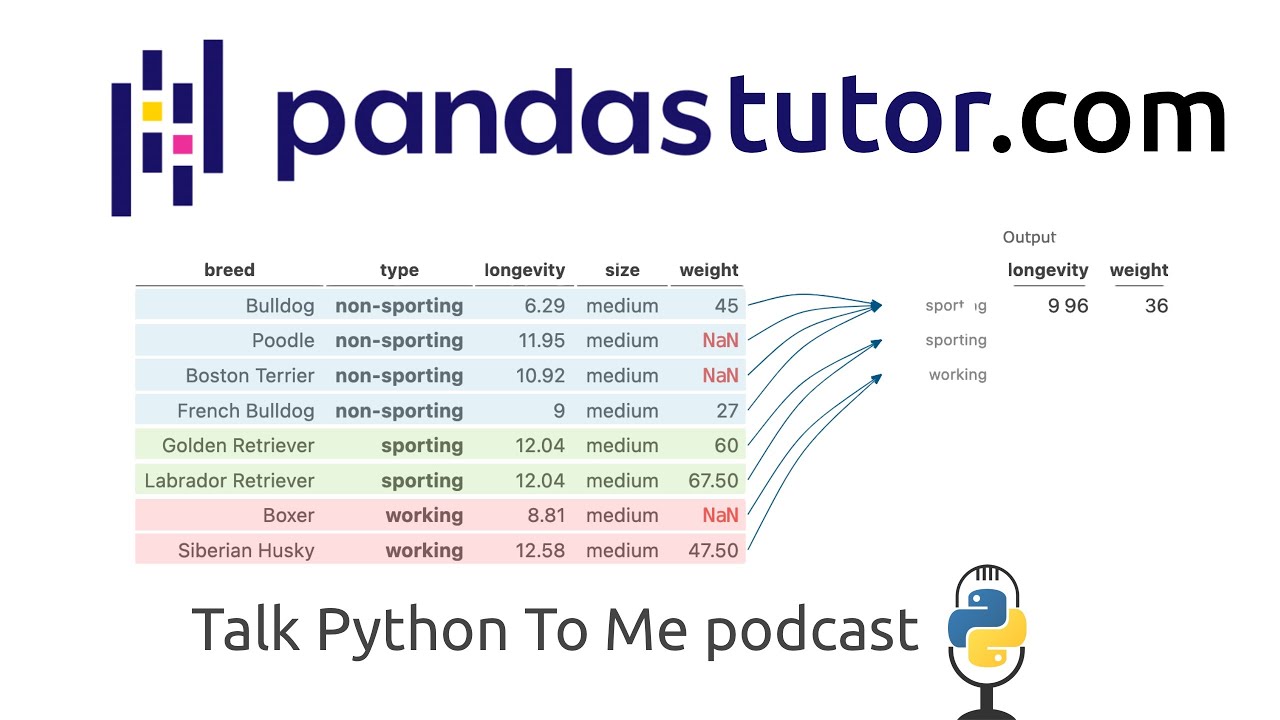
28:20 And in this case, what we're doing instead is because we've grouped the data frame before taking the median, pandas does the median within each group.
28:27 So it'll find the median longevity and weight for the non-sporting dogs and then for the sporting dogs and then for the working dogs.
28:34 And so what we're doing in the diagram here is we're showing how the four non-sporting dogs on the left side get kind of aggregated together into one row on the right-hand side.
28:46 So there's four arrows going from like four rows on the left side that go into one row on the right.
28:50 Yeah, that's awesome.
28:51 And this is probably that case where showing where the lines go is most interesting because there's like the first four results are all non-sporting.
29:00 So they contribute to row one.
29:02 So you've got all these arrows going into that first group and so on.
29:05 That's right.
29:05 I think that really helps visualize how this is computed.
29:08 Yeah, and that's right.
29:09 And group by is especially a tricky thing when we teach students because students are like, I understand sorting because like, you know, the rows get moved around.
29:17 When we do group by and then do something afterward, all of a sudden like my rows disappear.
29:21 Like where did my rows go?
29:22 And so here we can see exactly where all the rows go.
29:24 Yeah, that is very tricky because often you don't see that group by intermediate representation.
29:29 Yeah, yeah.
29:31 And pandas actually does not help people understand the group by.
29:35 So in a notebook, if you do dot group by by itself, all you get back is like this pandas group by object at some memory address.
29:44 And that's for novices.
29:46 It's like, I don't know.
29:47 I have no idea what just happened.
29:48 And so what we decided to do here as kind of like a design step is instead of showing the default group by like display, which is just text, we expanded that out to the original data frame plus some colors.
30:00 Yeah, yeah.
30:01 It really is a great visualization.
30:03 So I guess while we're talking about setting up your code, one thing that's interesting here is I can go to the top and I can jam in my code and I could do, you know, maybe I could change this to like, I don't know, max.
30:14 Is that going to work?
30:15 I got a different result by running, you know, dot max.
30:18 And I might play and explore and so on.
30:21 And then I'm like, I want to save this.
30:23 I'm going to save it for myself or I want to share it on Twitter because I just got to say something on Twitter and let people check it out.
30:30 I want to put it in the gist.
30:31 I want to share with my students, whatever.
30:34 So you'll have a handy little thing at the bottom that lets you create sort of a shareable link type of thing.
30:40 How does that work?
30:41 Do you just base64 encode the stuff at the top into the URL or what happens?
30:46 It's actually even simpler than base64 encoding.
30:48 We just put the code verbatim into the URL.
30:51 If you're looking at the URL, like the shareable URL, like you'll see that we put the code like import pandas as PD into the URL there.
31:00 Yeah, that's true.
31:00 It's just HTML.
31:01 No, it's URL encoded.
31:02 It's just URL encoded.
31:04 Yeah.
31:04 So we don't do anything super special with it.
31:06 And this works because URLs can actually be pretty long.
31:10 Like browsers will accept pretty long URLs.
31:12 And so for a lot of cases, we actually can't put the entirety of the code in the URL of software sharing.
31:19 This portion of Talk Python To Me is brought to you by the Stack Overflow podcast.
31:23 There are few places more significant to software developers than Stack Overflow.
31:29 But did you know they have a podcast?
31:30 For a dozen years, the Stack Overflow podcast has been exploring what it means to be a developer and how the art and practice of software programming is changing our world.
31:41 Are you wondering which skills you need to break into the world of technology or level up as a developer?
31:46 Curious how the tools and frameworks you use every day were created?
31:49 The Stack Overflow podcast is your resource for tough coding questions and your home for candid conversations with guests from leading tech companies about the art and practice of programming.
32:00 From Rails to React, from Java to Python, the Stack Overflow podcast will help you understand how technology is made and where it's headed.
32:08 Hosted by Ben Popper, Cassidy Williams, Matt Kierninder, and Sierra Ford, the Stack Overflow podcast is your home for all things code.
32:16 You'll find new episodes twice a week wherever you get your podcasts.
32:20 Just visit talkpython.fm/stackoverflow and click your podcast player icon to subscribe.
32:26 And one more thing.
32:27 I know you're a podcast veteran and you could just open up your favorite podcast app and search for the Stack Overflow podcast and subscribe there.
32:33 But our sponsors continue to support us when they see results and they'll only know you're interested from Talk Python if you use our link.
32:40 So if you plan on listening, do use our link, talkpython.fm/stackoverflow to get started.
32:45 Thank you to Stack Overflow for sponsoring the show.
32:50 So people can come down here and they can copy this URL and then they can do whatever they want.
32:54 Either save it as a bookmark for themselves or share it, right?
32:57 That's cool.
32:57 Yeah, that's right.
32:58 So the idea is if I had, let's say, like an email I'm sending to a colleague and I send them a little picture of data frames, like with some arrows,
33:07 I can also send this URL, which will let the other person view like the original code I used to create the diagrams.
33:13 Sure. So maybe it makes sense to do like a snapshot screenshot of just one step and then you say, well, here you can explore the whole thing and rerun it and so on.
33:22 It also kind of leads to the reproducible publications, reproducible science.
33:28 You know, if you're trying to explain to people what this step does, it might be worth putting that in the paper, right?
33:33 Yeah, exactly.
33:34 Yeah. And one use case we imagined was like, let's say for a lecture slide, I'll take a screenshot of this page.
33:40 I can also put in the URL, like some small text at the bottom of the lecture slide so people can play around with it afterward.
33:46 You need a URL shortening service, like a pandas.toot.or slash 170.
33:54 Yeah, yeah.
33:55 I don't even know .ORs or domains, but they should be.
33:58 I don't know. Maybe.
33:59 But like a bit.ly equivalent of a short one. Yeah. Cool.
34:03 Yeah.
34:04 All right. Well, I do see there's a place I can suggest improvements. So like I can just talk to you and tell them.
34:09 Yeah, yeah. Just send us a little email.
34:11 Yeah. One thing we do want to do is to include like a, like save this diagram as a PNG or SVG button.
34:19 Oh, nice.
34:19 We haven't gone around to it, but we would like to include that at some point.
34:23 Yeah, that'd be great. You know what would be fantastic is save it as an animated GIF.
34:26 Yeah, that would be cool.
34:27 Where you could sort of see like the little arrows run by or something.
34:32 Yeah, that'd be fun.
34:33 That's a cool idea. Yeah. Yeah. Think about that.
34:35 Well, just give me more work. So super cool project. This project is part of your PhD work, right?
34:42 Yeah, that's right.
34:43 Yeah. What's next? Where's it going from here?
34:46 I'm looking to graduate like next year's spring. So my hope is that this project will be like a major piece of piece of the thesis and I'm going to talk about it a lot. And as for the tool next steps in the short term, we'd like to expand the types of visualizations it can do. So right now it doesn't know how to do joins, for instance, or pivots. And so we really like to include those because those also tend to be like really confusing for people learning.
35:13 Right. And they're in the group by category of hard to understand. Yeah.
35:17 Yeah. Yeah.
35:18 I think they're worse, actually.
35:19 Yeah. It's a toss up, I think, in my experience. People, students who struggle, students will always have one, at least one of those three to struggle with. Group buys, joins, and pivots. Those three are just really confusing.
35:30 And longer term for this tool, we're thinking it would be great to have it, as I alluded to a little bit earlier, have a version of it that we can embed into Stack Overflow or even the Pandas documentation itself. And we're also looking at different alternative ways of drawing arrows and colors to see what can help students. And then we're also looking at ways of applying this general code analysis approach to other tools for visualization.
35:57 Yeah. There's certainly other tools that could benefit from it, although not so many of them as popular as Pandas. But for example, like Dask. Dask is panda-like, but it's fairly complicated what happens to compute stuff.
36:11 Yeah.
36:11 I mean, not understanding the ideas of it necessarily, but it's like, okay, well, it's going to go after this cluster and these things happened. There could be interesting things there.
36:19 Yeah, totally. Like there's Dask and now there's like other tools like Ray and like, there's even, even like if we're going really far out, there's like tools like Spark and like MapReduce and stuff that distribute computing across different computers. Visualizing those would be really cool.
36:33 Because, you know, for me as a user of those tools, sometimes it's like when like one computer breaks, it's really hard to debug and figure out what happened.
36:40 It definitely is. Another one is just database queries.
36:44 Oh yeah, for sure.
36:45 Right. I mean, it's pretty similar. You've got like group buys, you've got sorting, you've got filtering, select where clauses. And yeah, I think that would be a pretty natural match as well. But yeah, there's a lot of places for it to go. So very cool. Are you using this in any of your courses and things like that?
37:01 At the moment, I'm not teaching any data science courses, but this summer I will be teaching a course at UC San Diego. And so I'm really hoping to use this tool to like make some little diagrams to copy and paste into my lecture slides. Before I would make these diagrams manually using like Google slides, like arrows and shapes and such. But it's a huge pain. It's a massive pain.
37:22 Oh gosh, I know. It's so painful. As somebody who does online courses, I'm like, I really want to put some arrows and show how this goes. Like, oh boy, this is a lot of work.
37:30 It's a lot of work. It's a lot of work.
37:32 Yeah. I've actually used a Python tutor in my beginner Python course to show people like, okay, when you have two variables, but they point to the same object in memory, here's why changing one of them changes the other, for example, because you're really the same. They're just like pointing at the same thing. So they're changing the thing they point at and whatnot. Pretty cool. So very nice.
37:52 Yeah. And you're also working on a book, right?
37:55 Yeah. It's a book. The website right now says principles and techniques of data science, but we're renaming the book to learning data science.
38:02 Okay, cool. Now, when is that coming out?
38:05 Ooh, that's a great question. A question to ask every book author.
38:09 Yes, I know.
38:11 We're really hoping to get a first cut of it by the end of this year. We're about like one third or halfway through the content right now.
38:20 But we're hoping to get like the first cut of it out by the end of this year and then going through the whole like editing cycle and like publication, like before publication work and have it published sometime in the year after.
38:32 Yeah. Fantastic. Well, good luck on that.
38:35 You know, we are getting a little bit short on time, mostly because I have an extra tight constraint today. Sorry about that.
38:41 No problem.
38:42 But let's talk a little bit about the internals. So we talked about uploading some code in the text area field of the website, how it runs in a Docker container. It has restrictions.
38:52 But how do you all pull this off? Like understanding some of these things that we're getting color and pictures and arrows for. I don't think that's built into Pandas or Python, is it?
39:02 No, it's not.
39:03 How do you pull this off?
39:04 Yeah. So what we're doing to actually make this work is we're parsing the code behind the scenes and then running each step like using a sort of like a debugger.
39:17 So what we're doing is we parse the code to split it up into the steps that we want to run. So in this case, we would split it up to say the first step is dogs and the second step is filtering. And the third step is sorting and then grouping and then taking the max.
39:30 So you don't go all the way down to like disassembly. Do you like disk dot disk? Because that many more steps than this. Okay.
39:37 Yeah. Yeah. So we're trying to keep it roughly at like the level of function calls. We just split up into its individual function calls. And in this case, we have like a slice syntax for filtering. So we split that up as well.
39:50 Okay. So then you basically run each step. You have the before data frame and the after data frame.
39:56 That's right. Yeah. So we run each step.
39:58 Unwound expression. Yeah.
39:59 We run each step, get like the left-hand side and the right-hand side. And then we essentially have some like special rules where if we do sort values, we'll like use this rule for drawing arrows.
40:10 If we see a group by, we'll use this rule for drawing arrows. So underneath the hood is really just a lot of heuristics and rules for specific pandas functions.
40:18 Yeah. So you might say, all right, if it's doing a group by and here's the groups, here's how we're going to understand which group this goes to.
40:26 So you're like, all right, it's grouping on the type column.
40:29 That's right.
40:30 So then you know which thing to point it to. I see.
40:32 Yeah, that's right. And we could have done a smarter approach using like some, like, I don't know,
40:37 some deeper co-analysis or machine learning.
40:39 But I think for teaching purposes, we really wanted to avoid the case where we draw arrows like wrongly.
40:46 So we draw arrows that are not supposed to be there.
40:49 Yeah.
40:49 That'd be confusing, wouldn't it?
40:51 Yeah. Yeah. And especially for learners, like we would rather just like not draw arrows and draw wrong arrows.
40:57 I think that was like our main, one of the main design decisions here.
41:01 So that's why we resorted to like a simple approach of just using like rules and heuristics, but it gets the job done.
41:06 Sure. What about source code? Can people come and check it out and play with it?
41:11 Or is it really they can just play with the website?
41:14 Right now, only the website's available for the public.
41:17 Like the source code right now, we're thinking about like making it open source.
41:21 But right now it's not really in a state for the rest of the world to see.
41:25 Uh-huh. What about the front end stuff here?
41:27 When I went and did a view source on it, there's not a lot to see.
41:30 Basically some JavaScript and like five or six empty locations on the page, right?
41:37 What's the story there?
41:38 Yeah. Yeah. So the front end code is a similar story as the back end code.
41:42 It's like pretty messy and very specific to our workflows right now.
41:46 So getting, so essentially the issue right now is getting it set up on someone else's computer would be like a massive pain.
41:53 That's one of the main issues with releasing the source code out is that if we were to release it right now as open source and people want to play around with it,
42:02 then we would probably get tons of emails from people asking how to like debug this one like really weird step that we're doing or how to make it work.
42:09 So that's something that we'd like to get around to.
42:11 But for the first release, unfortunately, we ran out of time and we just wanted to get the tool out the door.
42:15 Yeah, I know. That's the most useful bit is for people to go and play with it, right?
42:19 Yeah. Yeah.
42:19 Fantastic. Any chance of an offline version like a progressive web app?
42:24 So I actually would like a version of this tool that would work as a JupyterLab extension because JupyterLab has like a Python back end that we can make use of.
42:35 Yeah.
42:35 So I could totally imagine this being used like directly in a notebook and displaying the diagrams directly in a notebook without needing to go to planetary.com.
42:44 What about WebAssembly and PyIodide?
42:46 Oh, yeah, yeah. We thought about that too.
42:48 That's another like far-fetched idea we like to do.
42:50 We've seen like PyIodide right now is just super cool to me.
42:53 And I'd really like to do it.
42:54 And you could turn on like the internet accessibility and stuff again, right?
42:58 Totally.
42:58 Because it's all running on the cloud.
42:59 They're only going to hack themselves or use their own resources, right?
43:02 Yeah, yeah.
43:03 You know what?
43:03 That's great.
43:04 That's a great point.
43:04 I didn't even think about that.
43:05 But that totally makes sense.
43:07 It's coming along pretty well.
43:08 And Steve Dower was just telling us that they're starting to do official WebAssembly builds out of CPython.
43:15 So it's a little more stable than some other projects.
43:19 So I think there's progress in the WebAssembly space.
43:22 And the PyIodide guys have got some of the data science libraries compiled into it.
43:27 Yeah, possibly.
43:29 I don't know what that means in terms of your system that understands and takes it apart.
43:33 That could be totally tricky.
43:34 But maybe that's an option.
43:36 Yeah, I think it's really viable.
43:37 I really like to look into it in the months to come.
43:39 Yeah, for sure.
43:40 All right.
43:41 Well, Sam, I'm afraid that's all the time we got to talk about today.
43:43 So before, though, we get to move off of this, tell us about the final two questions.
43:49 If you're going to write some Python code, what editor are you using these days?
43:52 My editor right now is VS Code.
43:54 I've flipped.
43:55 I've jumped editors from like Notepad++ to like Sublime to like Vim and Emacs.
44:01 And now I'm settling into the VS Code world.
44:04 It's got me.
44:04 Yeah, cool.
44:05 Right on.
44:05 And then notable PyPI package.
44:08 Ooh.
44:08 Something you found, you're like, oh, that's really cool.
44:10 Honestly, I'm really vibing with TQDM right now.
44:14 I always forget how to pronounce it, but I really like that one.
44:16 It displays a little progress bar for looping.
44:19 And I just think it's a really nicely done package.
44:21 Yeah.
44:21 If you just do wrap, just do a decorator and you do a for loop or something like that.
44:26 I don't remember the exact API, but then you just do a for loop and it'll just automatically
44:29 do a progress bar.
44:30 That's right.
44:31 It's fantastic.
44:32 That's right.
44:32 I love it.
44:32 Yeah.
44:33 Super cool.
44:34 All right.
44:34 Final call to action.
44:35 People want to visualize their Pandas code.
44:38 What do you tell them?
44:39 I tell them, go to pandasvery.com and put your code in and see what comes out.
44:44 Awesome.
44:44 And I encourage people when you go there, try to interact with the diagrams, right?
44:48 There's a lot of stuff going on that it doesn't look at first interactive, but it is.
44:52 So yeah, go play around.
44:53 Sam, thanks for being on the show.
44:55 Thanks, Michael.
44:56 I'm great to have you here.
44:56 It was really great.
44:57 It was a lot of fun for me and I really enjoyed talking to you about it.
45:00 Same.
45:00 Bye.
45:01 Okay.
45:01 See you.
45:03 This has been another episode of Talk Python To Me.
45:06 Thank you to our sponsors.
45:08 Be sure to check out what they're offering.
45:09 It really helps support the show.
45:11 Add high-performance, multi-party video calls to any app or website with SignalWire.
45:16 Visit talkpython.fm/SignalWire and mention that you came from Talk Python To Me to get started
45:22 and grab those free credits.
45:23 For over a dozen years, the Stack Overflow podcast has been exploring what it means to
45:27 be a developer and how the art and practice of software programming is changing the world.
45:32 Join them on that adventure at talkpython.fm/Stack Overflow.
45:36 Want to level up your Python?
45:38 We have one of the largest catalogs of Python video courses over at Talk Python.
45:42 Our content ranges from true beginners to deeply advanced topics like memory and async.
45:47 And best of all, there's not a subscription in sight.
45:50 Check it out for yourself at training.talkpython.fm.
45:53 Be sure to subscribe to the show, open your favorite podcast app, and search for Python.
45:58 We should be right at the top.
45:59 You can also find the iTunes feed at /itunes, the Google Play feed at /play,
46:04 and the direct RSS feed at /rss on talkpython.fm.
46:08 We're live streaming most of our recordings these days.
46:12 If you want to be part of the show and have your comments featured on the air,
46:15 be sure to subscribe to our YouTube channel at talkpython.fm/youtube.
46:20 This is your host, Michael Kennedy.
46:22 Thanks so much for listening.
46:23 I really appreciate it.
46:24 Now get out there and write some Python code.
46:26 Bye.
46:27 Bye.
46:27 Bye.
46:27 Bye.
46:27 Bye.
46:27 Bye.
46:28 Bye.
46:29 Bye.
46:30 Bye.
46:30 Bye.
46:30 Bye.
46:30 Bye.
46:30 Bye.
46:31 Bye.
46:31 Bye.
46:32 Bye.
46:33 Bye.
46:34 Bye.
46:35 Bye.
46:36 Bye.
46:37 Bye.
46:38 Bye.
46:39 Bye.
46:40 Bye.
46:41 Bye.
46:42 Bye.
46:43 you you you Thank you.