Microsoft Planetary Computer


Panelists


Episode Deep Dive
Guests Introduction and Background
Rob Emanuele and Tom Augspurger are both seasoned Python developers at Microsoft, working on the Planetary Computer project. Rob has a background in mathematics, initially coding in Power Builder and C extensions for Python, before diving into the open-source ecosystem. Tom began using Python for econometric research, contributing to open-source libraries like pandas and Dask while at Anaconda. They joined Microsoft’s small team focused on the Planetary Computer to combine environmental and climate data with modern cloud computing, enabling large-scale analytics for sustainability and climate research.
What to Know If You're New to Python
This conversation is heavy on data science and cloud computing, but don’t let that discourage you if you’re just starting out. Here are a few pointers:
- Understand fundamental data structures like dictionaries and lists—this will help you parse and manage datasets.
- Familiarize yourself with basic libraries such as requests (for HTTP), pandas (for tabular data), and possibly Dask (for parallel workloads).
- Know that Jupyter and notebooks are common for data exploration; you’ll see references to them throughout the conversation.
Key Points and Takeaways
- Microsoft Planetary Computer: Core Mission and Components
The Planetary Computer is a cloud-based platform at Microsoft that combines petabytes of open Earth observation data with powerful compute resources in a hosted Jupyter environment. By gathering data on topics such as climate and biodiversity, it allows researchers and organizations to process and analyze massive datasets without worrying about setting up their own infrastructure.
- Links and Tools:
- Petabyte-Scale Data and Storage
The Planetary Computer stores many petabytes of satellite imagery and environmental data in Azure Blob Storage. A key part of the project is providing a scalable way to host data in cloud-friendly formats (like Cloud-Optimized GeoTIFF and Zarr) so that researchers can efficiently query exactly the slices of data they need.
- Links and Tools:
- API-Driven Access through STAC
They use STAC (SpatioTemporal Asset Catalog) to index and serve data. Rather than downloading huge files just to figure out where they cover, STAC-based APIs make it quick to search for the region or timeframe needed. This ensures a user only processes relevant images or records.
- Links and Tools:
- Hosted JupyterLab Environment (The “Hub”)
The Planetary Computer includes a JupyterHub-based environment, so you can log in and immediately start coding against the data. Users can scale their computations via Dask clusters running under the hood—no need to spin up Kubernetes directly.
- Links and Tools:
- Data Processing with Dask and Xarray
Large workloads become manageable with libraries such as Xarray, which uses Dask to process arrays in parallel. You can load thousands of files, lazily evaluate them, and then produce transformations (e.g., cloudless mosaics) by simply calling
.persist()or.compute()to offload tasks to the cluster. - Geospatial Data Catalog Highlights
Key datasets include Sentinel-2 imagery (10-meter resolution, updated every five days), Landsat 8 (30-meter resolution), DayMet (gridded weather), and more. These open-source remote sensing datasets are pivotal for research on land cover, climate patterns, and ecological changes.
- Links and Tools:
- Event-Driven Ingest and Azure Batch
New satellite imagery arrives daily, and the Planetary Computer pipeline automatically ingests the data in parallel using Azure Batch. Tools like Event Grid can trigger tasks on every new blob, meaning fresh imagery gets indexed and becomes available quickly for climate scientists.
- Links and Tools:
- Collaboration with Partners and Grants
Microsoft’s AI for Earth grants program supports organizations in building new sustainability-focused applications. Some partners, like CarbonPlan, create public tools that leverage the data on Planetary Computer for mapping wildfire risk or land cover changes.
- Links and Tools:
- Open-Source Ecosystem and Community Focus
Much of the ETL and metadata extraction pipeline is open source, encouraging community contributions. It’s important that the data remain truly “open,” allowing external projects to tap into Planetary Computer data or replicate its architecture in their own Azure subscriptions.
- Links and Tools:
- Future of Sustainability and Climate Research The conversation emphasizes that climate change research and large-scale environmental data science will become increasingly critical. Platforms like Microsoft’s Planetary Computer aim to empower specialists, scientists, and even curious developers to dive into these crucial datasets without immense startup costs.
- Links and Tools:
Interesting Quotes and Stories
- Rob on discovering Python: “I come from a math background... I actually credit Python… setting me on a better development path for sure.”
- Tom on Dask dashboards: “It’s kind of like defragging your hard drive... you watch these little bars go across… it’s bizarrely satisfying.”
- Future-looking statement: “We’re already in it. We’re already feeling the effects... This is the data about our Earth, and it’s going to become more and more important as we mitigate and adapt…”
Key Definitions and Terms
- Planetary Computer: Microsoft’s cloud-based platform combining environmental datasets with large-scale compute resources.
- STAC (SpatioTemporal Asset Catalog): A specification for describing and searching geospatial data.
- Dask: A Python library for parallel computing, often used with Xarray and pandas to process large amounts of data efficiently.
- Cloud-Optimized GeoTIFF: A TIFF-based raster format designed for efficient reading in cloud environments, without downloading an entire file.
Learning Resources
If you want to improve your Python fundamentals or need a refresher on concepts mentioned during the episode, here are some courses that might help you go deeper.
- Python for Absolute Beginners: A solid entry point into Python if you’re new or returning after a long break.
- Fundamentals of Dask: If you want to learn how Dask helps process large datasets and leverage parallel computing in Python.
Overall Takeaway
The Microsoft Planetary Computer aims to make massive amounts of Earth science and climate data accessible to anyone, from seasoned researchers to hobbyist coders. By leveraging open-source standards like STAC, plus flexible Python libraries including Dask and Xarray, the platform provides a seamless way to explore petabyte-scale data—no specialized infrastructure expertise required. This forward-looking initiative not only unlocks critical information needed to understand and address climate change but also showcases how Python and the cloud can accelerate real-world scientific discovery.
Links from the show
Tom Augspurger on Twitter: @TomAugspurger
Video at example walkthrough by Tom if you want to follow along: youtube.com?t=2360
Planetary computer: planetarycomputer.microsoft.com
Applications in public: planetarycomputer.microsoft.com
Microsoft's Environmental Commitments
Carbon negative: blogs.microsoft.com
Report: microsoft.com
AI for Earth grants: microsoft.com
Python SDK: github.com
Planetary computer containers: github.com
IPCC Climate Report: ipcc.ch
Episode #334 deep-dive: talkpython.fm/334
Episode transcripts: talkpython.fm
---== Don't be a stranger ==---
YouTube: youtube.com/@talkpython
Bluesky: @talkpython.fm
Mastodon: @talkpython@fosstodon.org
X.com: @talkpython
Michael on Bluesky: @mkennedy.codes
Michael on Mastodon: @mkennedy@fosstodon.org
Michael on X.com: @mkennedy
Episode Transcript
Collapse transcript
00:00 On this episode, Rob Emanuel and Tom Augsberger join us to talk about building and running
00:04 Microsoft's Planetary Computer Project. This project is dedicated to providing the data around
00:10 climate records and the compute necessary to process it with the mission of helping us all
00:15 understand climate change better. It combines multiple petabytes of data with a powerful
00:20 hosted JupyterLab notebook environment to process it. This is Talk Python To Me, episode 334,
00:28 recorded September 9th, 2021.
00:30 Welcome to Talk Python To Me, a weekly podcast on Python. This is your host, Michael Kennedy.
00:48 Follow me on Twitter where I'm @mkennedy and keep up with the show and listen to past episodes
00:53 at talkpython.fm and follow the show on Twitter via at talkpython.
00:57 We've started streaming most of our episodes live on YouTube. Subscribe to our YouTube channel over
01:03 at talkpython.fm/youtube to get notified about upcoming shows and be part of that episode.
01:08 This episode is brought to you by Shortcut, formerly known as clubhouse.io,
01:14 and us over at Talk Python Training. And the transcripts are brought to you by Assembly AI.
01:19 Rob, Tom, welcome to Talk Python To Me.
01:22 Thank you.
01:23 Good to have you both here. We get to combine a bunch of fun topics and important topics,
01:29 data science, Python, the cloud, big data, as in physically lots of data to deal with. And then
01:36 also climate change and being proactive about studying that, make predictions and do science
01:42 on huge amounts of data.
01:43 For sure. Looking forward to it.
01:44 Yeah, this will be fun.
01:45 Yeah, absolutely. Before we get into those, let's just start real quickly. How do you two get into
01:49 programming and Python? Rob, start with you?
01:51 Yeah, sure. So I've been a developer for, I don't know, let's say 14 years. I started at a shop that
01:58 was doing Sybase Power Builder.
02:00 That goes back a ways.
02:02 That's back a ways. And I actually, I come from a math background, so I didn't know a lot about
02:07 programming and started using Python just sort of like on the side to parse some bank statements and
02:13 do some personal stuff and started actually like integrating some of our source control at the
02:18 company with Python and had to write some C extensions. So got into the Python source code
02:24 and started reading, you know, that code and being like, oh, this is how programming should
02:29 work. Like this is really good code. And that year went to my first PyCon. It was just like all in.
02:35 I need to get, you know, a different job where I'm not doing Power Builder.
02:39 And yeah, really, I kind of credit Python and the code base and setting me on, you know,
02:44 a better development path for sure.
02:45 Oh, that's super cool. Python's a fun experience, isn't it?
02:48 Oh, yeah.
02:49 Yeah. It's like my geek holiday, but sadly, the geek holiday has been canceled the last two years.
02:54 Oh, no.
02:55 Yeah.
02:55 Yeah. Tom, how about you?
02:57 Kind of similar to a lot of your guests, I think. I was in grad school and had to pick up
03:01 programming for research and simulations. This is for economics.
03:07 They started us on MATLAB and Fortran. It goes back maybe further, almost as far as you can go.
03:12 And anyway, I didn't really care for MATLAB. So moved over to Python pretty quickly and then
03:18 just started enjoying the data analysis side more than the research side and got into like that whole
03:25 open source ecosystem around pandas and stats models and econometrics library. So I started
03:32 contributing to open source, dropped out, got a job in data science stuff, and then moved on to
03:38 Anaconda where I worked on open source libraries like Pandas and Dask for a few years.
03:43 Yeah. In a weird turn of coincidence, a weird coincidence, I was just the previous episode
03:48 with Stan Sievert, who you worked with over there, right?
03:51 Yeah.
03:52 Yeah. So he's the director of community innovation. And then, yeah, it was a great place to work at.
03:58 Really enjoyed it. And then came on to this team at Microsoft almost a year ago now working on the
04:02 planetary computer.
04:03 Yeah. Cool. Well, the planetary computer stuff sounds super neat. You get to play with all the
04:08 high-end computers and the big data and whatnot, right?
04:11 Yeah. It's a lot of fun. Although I did have a chance to play on, I think it was Summit, which is one of our
04:15 nation's supercomputers at my last show. So that was a lot of fun too.
04:19 Okay. Well, it's hard to beat that, right? That's one of the ones that's like, it takes up a whole room,
04:25 a huge room. That's pretty fantastic. Awesome. All right. Well, what are you two doing today?
04:29 You know, you're both on the planetary computer project. Are you working at Microsoft? What are you doing there?
04:34 Yeah. So we're on a pretty small team that's building out a planetary computer, which really
04:39 is sort of three components, which is a data catalog, you know, hosting a lot, you know,
04:45 petabytes, petabytes of data, openly licensed satellite imagery and other datasets on Azure's
04:51 blob storage. We're building APIs and running API services that ETL the data, encode metadata,
04:58 according to the stack specification, which we can get into later about that, those datasets,
05:03 putting them into a Postgres database and then building API services on top of that.
05:08 That's a lot of what I do is manage the ETL pipelines and the APIs and then expose that data
05:16 to users, environmental data scientists, and really anybody. It's just publicly accessible.
05:21 And yeah, that's sort of my side. And then there's a compute platform, which Tom can talk about.
05:26 Yeah. So all this is like in service of environmental sustainability. And so we have our primary users are like
05:32 people who know how to code mostly in Python, but they're not developers. And so, you know, we don't want them having to worry about things like Kubernetes or whatever to set up a distributed compute cluster.
05:44 So that's where we're kind of this hub comes as it's a place where users can go log in, get a nice convenient computing platform built on top of Jupyter hub and dash where they can scale out to these really large workflows to do whatever analysis they need, produce whatever derived data sets they need for them to pass along to their decision makers and environmental sustainability.
06:07 Yeah, that's super cool. The platform miller building people who might have some Python skills, some data science skills, but not necessarily high end cloud programming.
06:19 Right. Yeah. Handling lots of data, setting up clusters, all those kinds of things. You just push a button, end up in a notebook. The notebook is nearby petabytes of data. Right. Right. Exactly.
06:29 So we'll talk a lot about like cloud native computing data analysis. And so really what that means is just putting the compute as close as the data as possible. So in the same Azure region.
06:40 So you just need a big hard drive.
06:41 A really, really, really, really big hard drive.
06:44 That's what the cloud is. It's one third hard drive.
06:46 Exactly. It is. Yeah. So super neat. Before we get into it, though, let's just maybe talk real briefly about, you know, Microsoft and the environment. This obviously is an initiative you all are putting together to help client climate scientists study the climate and whatnot. But, you know, I was really excited to see last year that you all announced that Microsoft will be carbon negative by 2030.
07:09 Yeah, for sure. I mean, Microsoft and, you know, prior to me joining Microsoft, I didn't I didn't know any of this, but Microsoft's been on the forefront of, you know, corporate efforts and environmental sustainability for a long time.
07:21 And, you know, there's been an internal carbon tax that we place on business groups that were, you know, there's actual payments made based on how much carbon emission each business group creates.
07:32 And that's been used to fund the environmental sustainability team and all these efforts.
07:37 And that sort of culminated into these four focus areas and commitments that were announced in 2020.
07:44 So carbon is a big one, not just carbon negative by 2030, but by 2050, actually having removed more carbon than Microsoft has ever produced since its inception.
07:55 And that's over scope one, scope two and scope three, which means accounting for, you know, downstream and upstream providers.
08:02 And then there's a couple more focus areas around waste.
08:06 So by 2030, achieving zero waste and around water becoming water positive and ensuring accessibility to clean drinking and sanitation water for more than 1.5 million people.
08:18 There's an ecosystem element to by 2025, protecting more land than we use.
08:23 And then also creating a planetary computer, which is really using Azure's resources in the effort to model, monitor and ultimately manage Earth's natural systems.
08:36 That's awesome.
08:36 And that's the part you all come in, right?
08:38 Yeah, exactly.
08:38 The planetary computers in that ecosystem commitment.
08:41 And that's what we're working towards.
08:42 Yeah, very cool.
08:43 The removing all the historical carbon, I think is pretty fantastic.
08:47 And being carbon negative, right?
08:50 So much stuff runs on Azure and on these couple of large clouds that that actually is a statement about a large portion of the data center usage as well.
08:58 For sure.
08:59 How many data centers does Azure have?
09:00 Like three or four, right?
09:02 I think it's the most out of any of them.
09:04 It's a lot, right?
09:05 It's over 50 or something like that?
09:06 Large data centers?
09:08 I don't know.
09:08 But it's a big number.
09:09 They're building them all the time too.
09:10 Yeah.
09:11 Yeah, yeah.
09:11 It's like constant.
09:12 So that's a big deal.
09:14 Super cool.
09:15 All right.
09:15 Let's talk about this planetary computer.
09:18 You told us a little bit about the motivation there.
09:20 And it's made up of three parts, right?
09:23 All right.
09:24 Yeah.
09:24 So tell us about it.
09:25 So there's technically four parts.
09:27 We recognize that technology for technology's sake is just kind of spinning your wheels, right?
09:32 We have to be building all of this data, all this data access, the analytics platform towards
09:38 applying data and insights to actually making an impact on environmental sustainability concerns.
09:45 And that's done not by us, an engineering team, like kind of, you know, trying to figure out
09:49 the climate scientists, right?
09:50 We're engaging with organizations to build out applications specifically on these data and
09:56 services, you know, and partnering with organizations that have specific goals.
10:00 So there's an applications pillar to the planetary computer.
10:04 But from an engineering standpoint, we're mostly focused on the data catalog, the APIs,
10:10 and the hub that we had touched on briefly.
10:12 Yeah.
10:12 Yeah.
10:13 And then the applications is what the partners and other people building on top of it are really
10:17 doing, right?
10:18 Exactly.
10:18 And we participate in that and, you know, help bring different organizations together
10:23 to build out the applications and, you know, use the money that we have to actually fund
10:30 applications that are, you know, specifically aimed at different use cases.
10:34 Yeah.
10:34 Yeah.
10:34 Very cool.
10:35 There are some other things that are somewhat like this, right?
10:38 Like Google Earth Engine and AWS and probably could just grab this yourself.
10:42 You want to do a compare and contrast for us?
10:44 Sure.
10:44 Yeah.
10:45 So Google Earth Engine is sort of the bar that's set as far as using cloud compute resources
10:51 for earth science.
10:54 And it's an amazing platform that's been around for a long time and is really just like a
10:59 giant compute cluster that has interfaces into an API and sort of like a JavaScript interface
11:05 into it that you can run geospatial analytics.
11:08 And so it's a great, you know, like I said, a great tool.
11:12 Can't sing its praises enough.
11:13 One of the aspects of it that make it less useful in certain contexts is that it is a little
11:21 bit of a black box, right?
11:22 The operations, the geospatial operations that you can do on it, the way that you can
11:26 manipulate the data are sort of whatever Google Earth Engine provides.
11:30 If you wanted to run a PyTorch model against a large set of satellite imagery, that's like
11:35 a lot more difficult.
11:36 You can't really do that inside a Google Earth Engine.
11:38 You have to like ship data out and ship data in and getting data in and out of the system
11:42 is a little tough because it's like sort of a singular solution.
11:45 And they can optimize a lot based on that.
11:48 So the approach we're taking is more a modular approach, leaning heavily on the open source
11:53 ecosystems of tools, trying to, you know, make sure that the open source users are first class
12:00 users that we're thinking of first.
12:01 And that if people want to just use our data, we just have cloud optimized geotiff, you know,
12:06 these, these flat file formats on blob storage, go ahead and use it.
12:10 You don't have to use any of the other stuff that we're building.
12:12 But if you want to do space to temporal searches over it, we provide an API that's free access
12:17 that allows you to do searches and get metadata about the data so you don't have to actually
12:22 read in the bytes.
12:24 And then also providing the hub experience, which brings together that really rich open source
12:30 ecosystem of Python tooling, including our tooling.
12:33 And we're also building out, you know, other mechanisms to access this data.
12:37 But those current focuses is really on that Python data science.
12:41 But yeah, considering the open source ecosystem sort of as our user experience and trying to
12:47 treat that as like the first class use case.
12:49 Yeah, that's fantastic.
12:50 Tom, tell me if I have this right.
12:52 I feel like my limited experience working with this is you've got these incredible amounts
12:57 of data, but they're super huge.
12:58 You all built these APIs that let you ask questions and filter it down into like, like, I just want
13:04 the map data for this, you know, polygon or whatever.
13:07 And then you provide a Jupyter notebook and the compute to do stuff on that result.
13:12 Is that pretty good?
13:13 Yeah.
13:14 Yeah, that's pretty good.
13:15 If you just think like the API is so crucial to have and we'll get into what it's built on.
13:20 But just for like the Python analogy here is like, imagine that you only had lists for your
13:26 data structure.
13:26 You don't have dictionaries.
13:27 And now you have to like traverse this entire list of files to figure out where is this one
13:34 at like in space on Earth?
13:35 Where is it at?
13:36 Or what time period is it covering?
13:38 And, you know, the nice thing about the API is you're able to do very fast lookups over
13:43 space and time with that to get down to your subset that you care about.
13:47 And then bring it into memory on ideally on machines that are in the same Azure region,
13:53 bring those data sets into memory using tools like Xarray or Pandas and Dask, things like
13:59 that.
13:59 Yeah.
13:59 Very cool.
14:00 So, Rob, you mentioned the Postgres database.
14:03 Does that do you parse this data and generate the metadata and all that and then store some
14:08 of that information in the database so you get to it super quick and then you've got the
14:11 raw files as blob storage, something like that?
14:14 Yeah, for sure.
14:14 I mean, that's as much metadata that you can capture and to describe the data so that you
14:21 can kind of, you know, do what Tom said and like ignore the stuff that you don't care about
14:24 and just get to the area that you care about.
14:26 We try to extract that and we do that according to a spec that is this really interesting, like
14:32 community driven spec that one of the biggest complaints about dealing with satellite imagery
14:37 and this Earth's observation imagery is that it's kind of a mess.
14:41 There's a lot of different scientific variables and sensor variables and things.
14:45 So there's been a community effort over the past, say, three or four years to develop specifications
14:50 that make this type of information machine readable.
14:53 And so we've kind of bought fully into that and have processes to look at the data, extract
15:00 the stack metadata, which is just a JSON schema specification with extensions, and then write
15:06 that into Postgres.
15:08 And one of the things that we, you know, I've been trying to do for like transparency and
15:13 contribution to open source is a lot of that ETL code base, those Python, the Python code that
15:19 actually works over the files and extracts the metadata is open source in the stack utils,
15:25 GitHub organization.
15:26 So we're trying to contribute to that sort of body of work of how to generate stack metadata
15:32 for these different data types.
15:34 You want like the metadata for the exact same image that's coming from like the USGS public
15:40 sector data set.
15:41 You want the stack metadata to be identical for that, whether you're using our API or Google
15:47 Earth engines, who also provides a stack API.
15:50 And so like we're working together on these kind of like shared core infrastructure libraries.
15:57 This portion of Talk Python To Me is brought to you by Shortcut, formerly known as clubhouse.io.
16:02 Happy with your project management tool?
16:04 Most tools are either too simple for a growing engineering team to manage everything or way
16:09 too complex for anyone to want to use them without constant prodding.
16:12 Shortcut is different though, because it's worse.
16:15 No, wait.
16:16 No, I mean, it's better.
16:17 Shortcut is project management built specifically for software teams.
16:20 It's fast, intuitive, flexible, powerful, and many other nice positive adjectives.
16:25 Key features include team-based workflows.
16:28 Individual teams can use default workflows or customize them to match the way they work.
16:33 Org-wide goals and roadmaps.
16:35 The work in these workflows is automatically tied into larger company goals.
16:39 It takes one click to move from a roadmap to a team's work to individual updates and back.
16:44 Type version control integration.
16:46 Whether you use GitHub, GitLab, or Bitbucket, clubhouse ties directly into them so you can update
16:52 progress from the command line.
16:53 Keyboard-friendly interface.
16:55 The rest of Shortcut is just as friendly as their power bar, allowing you to do virtually
17:00 anything without touching your mouse.
17:02 Throw that thing in the trash.
17:03 Iteration planning.
17:05 Set weekly priorities and let Shortcut run the schedule for you with accompanying burndown
17:10 charts and other reporting.
17:11 Give it a try over at talkpython.fm/shortcut.
17:16 Again, that's talkpython.fm/shortcut.
17:19 Choose Shortcut because you shouldn't have to project manage your project management.
17:24 Well, let's dive into some of the data, actually, and talk a little bit about all these data sets.
17:30 So a lot of data, as we said over here.
17:34 Maybe highlight some of the important data sets that you all have on offer.
17:39 So Sentinel-2 is our largest and is incredibly important.
17:44 It's multispectral imagery, optical imagery that is 10 meter resolution.
17:50 So it's the highest resolution.
17:53 And when we talk about satellites, we often talk about what is the resolution that's captured.
17:57 Because, you know, something like Landsat, which we also have Landsat 8, is 30 meter resolution.
18:02 So once you get down to like street level, you can't really see.
18:06 Everything's blurry, right?
18:07 Right.
18:07 Each pixel represents 30 meters on the ground.
18:11 Right, right.
18:12 Okay.
18:12 So Sentinel is 10 meter.
18:14 You get a lot clearer picture.
18:15 You can, you know, track.
18:16 I mean, if you're doing, you know, sort of deforestation monitoring, for instance,
18:20 like you can really track the edge of the deforestation a lot better with 10 meter imagery.
18:25 Right.
18:25 Or glaciers and you want to understand the boundary of it or something.
18:28 Exactly.
18:28 And, you know, it's still pretty low resolution compared to commercially available imagery.
18:34 But as far as open data sets, it's high resolution.
18:37 It's passively collected.
18:38 I think the revisit rate is, I should have this offhand, I think it's eight days.
18:42 So you can really do like monitoring use cases with that.
18:45 It generates petabytes and petabytes of data.
18:48 So it's a lot to sort of work over.
18:50 I mean, generating the stack metadata for that, you know, it's like you got to fire up like
18:55 10,000 cores to kind of run through that.
18:58 And you end up actually reaching the limits of how fast you can read and write from different
19:04 services.
19:04 But my gosh.
19:05 Yeah.
19:05 But it's a really great, really great data set.
19:08 A lot of work is being done against Sentinel too.
19:11 So a lot of what I'm seeing and I'm reading through here is this annually or this from 2000
19:17 to 2006 or like the one we were just speaking about is since, you know, from 2016.
19:22 This data is getting refreshed.
19:24 And can I ask questions like, how did this polygon of map look two years ago versus last
19:31 year versus today?
19:31 Totally.
19:32 Yeah.
19:32 And you can do that with the sort of API to say, okay, here's my polygon of interest.
19:36 This is over my house or whatever, you know, fetch me all the images.
19:40 But a lot of satellite imagery, I mean, most of it is clouds.
19:44 It's just the earth is covered with clouds.
19:46 You're going to get a lot of clouds.
19:47 So there's also a metadata about the cloudiness.
19:51 So you can say, okay, well, give me these images over time, but I want the scenes to
19:56 be under 10% cloudy.
19:58 Right.
19:58 I'm willing for it to not be exactly 365 days apart, but maybe 350 because I get a clear
20:04 view if I do that.
20:05 Something like this.
20:05 Exactly.
20:06 And then you can make a little time lapse of how that area has changed over time.
20:11 And in fact, I think there was somebody who actually demoed a time lapse, a similar type
20:16 of time lapse, just grabbing the satellite imagery and turning it into a video over an area.
20:21 I forget.
20:21 Very neat.
20:21 That was.
20:22 Yeah.
20:22 That one, the Sentinel, the large one, the revisit time is every five days.
20:27 That's a lot of data.
20:28 That was a, yep.
20:29 Yeah.
20:30 Yeah.
20:30 Yeah.
20:31 It ends up a lot of data.
20:32 A lot of clouds in the cloud.
20:34 Yeah.
20:35 What about some of these other ones here?
20:36 The DayMet, which is gridded estimates of weather parameters in North America.
20:41 That's pretty interesting.
20:43 Yeah.
20:43 Yeah.
20:43 So DayMet's actually an example of a lot of our data is geospatial, like satellite imagery
20:49 or things that are derived from that, like elevation data sets where you're using the
20:54 imagery to figure out how, what's the elevation of the land or things like land cover data sets.
21:01 So if you scroll down just a tad, the land cover data set there, that's based off Sentinel, actually.
21:06 And so there's a saying, you know, for every pixel in Sentinel, they took like a mosaic over
21:11 a year.
21:12 What is the, that pixel being used for?
21:15 Is it water, trees, buildings, roads, things like that.
21:19 So those are examples based off of, of satellite imagery or aerial photography.
21:24 And then DayMet's an example of something that's like the output of a climate or a weather model.
21:29 So these are typically higher dimensional.
21:32 You're going to have things like, you know, temperature or maximum, minimum temperature,
21:36 water, pressure, vapor, all sorts of things that are stored in this really, you know, big
21:42 in dimensional cube at various coordinates.
21:45 So latitude, longitude, time, maybe height above.
21:49 So those are stored in typically in formats like Czar, which is this cloud native, very
21:55 friendly to object storage way of storing chunked in dimensional arrays.
21:59 Is it like, like streaming friendly?
22:01 You can stream part of it and seek into it, that kind of thing.
22:03 Exactly.
22:04 And all the metadata is consolidated.
22:05 So you can load in the whole data set and like, you know, less than a few hundred milliseconds,
22:11 but then access a specific subset very efficiently.
22:13 Sure.
22:14 Yeah.
22:14 Very neat.
22:14 Another one that's not directly based off of satellites is the high resolution electricity
22:21 access, I'm guessing.
22:22 And I guess you could sort of approximate it from lights, but is it, do you think it's light?
22:26 I think it is from Rod Dino.
22:28 Yeah.
22:29 So I think it's from.
22:30 Yeah.
22:30 It's V-I-I-R-S.
22:32 Satellite.
22:32 Okay.
22:33 So it is off of basically just steady and light.
22:35 Interesting.
22:35 And we have a few more that are coming online shortly, which are kind of more tabular.
22:39 So there's things like U.S.
22:41 Census gives you like the polygon.
22:43 So, you know, the state of Iowa has these counties or census blocks, which are this shape.
22:50 So giving you all those shapes and it has this population, things like that.
22:53 Things like GBIF has, which is, I think on there now, has occurrences of like, I think
22:58 they're like observations of somebody spotted this animal or plant at this latitude, longitude
23:03 at this time, things like that.
23:05 So lots of different types of data.
23:07 A mink was spotted running through the streets.
23:10 Okay.
23:10 Yeah.
23:10 Yeah.
23:11 Oh, you have one for agriculture.
23:12 That's pretty interesting.
23:13 If you're doing something with agriculture and farming and trying to do ML against that.
23:18 That's interesting because that's actually run by the National Agriculture.
23:22 That's actually aerial imagery, RGB, red, green, blue, and then also infrared aerial imagery
23:28 that's collected every about every three years.
23:31 So that's an example of high resolution imagery that's, you know, more than a, I think it's
23:36 one meter resolution.
23:37 Yeah.
23:38 You can see the little trees and stuff.
23:39 Exactly.
23:40 It's very, very accurate.
23:42 Yeah.
23:42 Great data set specific to the US.
23:44 So again, like Sentinel-2 is global in scope, but if you are doing things in the United States,
23:50 NAEP is a great data set to use.
23:52 Yeah.
23:52 You've got the USGS 3D elevation for topology.
23:56 That's cool.
23:57 And then you have some additional data sets.
24:00 What's the difference between the main ones and these additional ones?
24:03 Why are they separated?
24:04 We're catching up to where our stack API has all of the data sets we host, but the AI for
24:11 Earth program, which hosts all these data sets has been going on since 2017.
24:15 So there's plenty of data sets that they've been hosting that haven't yet made their way
24:19 into the API.
24:20 And that's, you know, just because we're getting there.
24:23 It's a bunch of work.
24:24 I see.
24:25 So for these additional ones, maybe I could directly access them out of blob storage, but
24:28 I can't ask API questions.
24:30 Exactly.
24:30 Okay.
24:31 And then another point, which is kind of interesting talking back to the tabular data is that some
24:36 of these data formats aren't quite, I mean, rasters and imagery is like fits really nicely
24:41 in stack.
24:42 And we know how to do spatial temporal queries over them.
24:44 But some of these data formats, you know, they're not as mature as maybe the raster data format, or it's not as clear how to host them in a cloud optimized format and then host them in a spatial temporal API.
24:56 So we're actually having to do work to say, okay, what are the standards?
24:59 Is it like geo parquet?
25:01 Or, you know, what are the formats that we're going to be using and hosting these data sets?
25:05 And then how do we actually index the metadata through the API?
25:08 So there's a lot of sort of data format and specification, metadata specification work before we can actually host all of these in the API.
25:15 Yeah, really nice.
25:16 A lot of good data here and quite large.
25:18 Let's talk about the ETL for just a minute because you threw out some crazy numbers there.
25:23 We're looking at the Sentinel-2 data and it gets refreshed every five days and it's the Earth.
25:29 Talk us through what has to happen there.
25:31 Yeah.
25:31 So for the Sentinel, it's actually, you know, daily.
25:34 So it's passive satellite collections.
25:37 So the satellites are just always monitoring, always grabbing new imagery.
25:42 And so that comes off to ground stations through the European Space Agency.
25:46 And then we have some partners who are taking that, converting it to the Cloud Optimus GeoTiff format, putting it on blob storage, at which point we run our ingest pipelines, look for new imagery, extract the stack metadata, insert that into the database.
26:02 And we just have that running in an Azure service called Azure Batch, which allows us to run parallel tasks on clusters that can auto scale.
26:11 So if we're doing an ingest of a dataset for the first time, there's going to be a lot of files to process and we can scale that up.
26:19 And it runs Docker containers.
26:21 So we just have a project that, you know, defines the Docker commands that can run.
26:25 And then we can submit tasks for chunks of the files that we are processing.
26:30 That creates the stack items.
26:32 And then another separate process actually takes the stack items and inserts it into the database.
26:37 That's cool.
26:38 So it's a little bit like data driven rather than a little bit like Azure Functions or AWS Lambda.
26:45 But processing, we just got to get all this data and just work through it kind of at scale.
26:50 Interesting.
26:51 Yeah, for sure.
26:52 Right now it's a little bit.
26:53 We're still building the plane as we're flying it.
26:56 But the next iteration is actually going to be a lot more reactive and based on another Azure service called Event Grid, where you can get notifications of new blobs going into storage and then put messages into queues that can then turn into these Azure Batch tasks that are running.
27:13 Right.
27:13 I see.
27:14 So you just get something that drops it in the blob storage and it kicks off everything from there and you don't have to worry about it.
27:19 Yep.
27:19 And then we publish those to, you know, our users saying, hey, this is ready now.
27:24 If they subscribe to that, that Event Grid topic.
27:27 Oh, that's cool.
27:28 There's a way to get notified of refreshes and things like that.
27:32 Not yet.
27:32 We're hoping to get that end of year.
27:34 But yeah, the idea is that we would have basically a live feed of new imagery.
27:39 I mean, what I would really like to see just for myself, my own interest is like,
27:43 to be able to have my areas of interest and then just go to a page that shows like almost an Instagram feed of Sentinel images over that area.
27:52 It's like, oh, this new one, it's not cloudy.
27:54 Look at that.
27:55 Look at that one.
27:55 You know, it's something I'm monitoring.
27:57 But yeah, generally we'll be publishing new stack items so that if you're running AI models off of the imagery as it comes in, you can do that processing based off of events.
28:06 Yeah, that'd be cool.
28:07 I'm only interested in Greenland.
28:08 I don't care if you've updated Arizona or not.
28:11 Just tell me if Greenland has changed.
28:13 Then I'm going to rerun my model on it or something.
28:14 Right.
28:15 Cool.
28:15 All right.
28:16 Let's see.
28:16 So that's the data part, data catalog.
28:19 And then we have the API and the hub, which I want to get to.
28:22 But I kind of want to just sort of put some perspective on what people have been doing with this, some of your partner stuff under the applications thing.
28:30 So, Tom, which ones do you think we should highlight from those that are interesting?
28:34 We kind of talked about the land cover data set.
28:37 So we worked with Impact Observatory to do that.
28:40 And so we had some tips about how to use Azure Batch because that's a very big Azure Batch job to generate that land cover map.
28:48 So pulling down the Sentinel data that we're hosting and then running their model over it.
28:53 So that was a fun data set to see come together and then use now.
28:58 The Carbon Plan, Carbon Monitoring Risk Assessment application.
29:03 That's like a really cool.
29:04 It's a cool like JavaScript application that you can view risks on.
29:09 So these companies are buying like carbon offsets that are forest trees that are planted to offset carbon.
29:17 But there's a problem that, you know, that we know about now is like the wildfires are burning down those some of those forests.
29:25 And so.
29:25 Right.
29:25 It doesn't help if you planted a bunch of trees to offset your carbon if they go up and smoke, right?
29:29 Right.
29:30 Yeah.
29:30 So Carbon Plan did a bunch of research, first of all, on essentially they did the research before that before our hub existed.
29:39 But, you know, we were working with these community members to and they have a very similar setup to what we have now to do the research, to, you know, train the models and all of that.
29:49 That goes into this visualization here of how likely, you know, what are the different risks for each plot of land in the U.S.?
29:57 Yeah.
29:57 So that was a great collaboration there.
29:59 One of the things I was wondering when I was looking at these is you all are hosting this large amounts of data and you're offering compute to study them.
30:07 How does something like Carbon Plan take that data and build this seemingly independent website?
30:13 Yeah.
30:13 Does that run directly on that data or do they like export some stuff and then run it on their side or what's the story?
30:19 They would have been doing all like the heavy duty compute ahead of time to train the models and everything to gather the statistics necessary to power this.
30:29 So then at that point, it's just a static JavaScript application just running in your browser now.
30:35 Oh, interesting.
30:35 And I think that's a good point because it's running against our data, but it's running in their own infrastructure.
30:40 Right.
30:41 So it's sort of on the planetary computer, but it's like really in this case, like using the planetary computer data sets in sort of a production setting that an infrastructure that they own, which is a use case we really want to support.
30:54 If, you know, if they need to use search in order to find the images that they need, they can use our stack APIs.
31:01 But really, it's like just an application running in Azure that, you know, in certain cases with our grants program, we'll end up supporting and sponsoring Azure subscriptions to run this type of infrastructure.
31:13 But at the end of the day, it's really just applications running in the cloud.
31:16 Right.
31:17 It's just better if that it's in Azure that it's nearby, but they could run it anywhere technically.
31:21 Right.
31:21 And just get signed blob storage access or whatever.
31:24 Yeah.
31:24 We'll throttle access at a certain point if you're trying to egress too much.
31:28 But yeah, I can imagine.
31:29 Yeah.
31:29 Yeah.
31:30 Yeah.
31:30 Yeah.
31:31 Very cool.
31:31 I can come over here and zoom in on Portland and it looks like we're in a decent bit of greenness still.
31:37 It does rain up here a lot.
31:38 Same for Seattle.
31:39 Yeah.
31:39 Yeah.
31:40 Yeah.
31:40 Quite cool.
31:41 You talked about this grant program.
31:42 What's the story that people out there listening, they're like, I want to get into working with this data and building things.
31:47 Grant might sound good to them.
31:49 What is that?
31:49 Awesome.
31:50 Yeah.
31:50 Look up AI for Earth grants.
31:52 We have rounds of supporting folks that are doing environmental sustainability work.
31:58 And there's a sort of a range of grant rewards.
32:01 The lowest level is like giving Azure credits.
32:04 You know, being able to sponsor an account or sponsor resources for applications that are being developed or research that's being done for environmental sustainability.
32:14 And we have folks running the grants program and go take the applications.
32:18 And there's different classes that we have and summits for each of the classes.
32:23 And then there's more involved grants and larger grants as usually as people sort of show progress, we can we actually can end up bringing additional resources or, you know, paid projects to accomplish specific goals.
32:36 But yeah, if anybody's out there and they're doing work in environmental sustainability that could benefit from the cloud, we'd love to work with you.
32:44 Well, just to clarify.
32:45 So there's, you know, the grants are great for like if you have like a complex deployment that's using a ton of Azure services and you want to like integrate this all together and use the planetary computer data, then the grants are a great approach.
32:59 If you're just like an individual researcher, a team of researchers or whoever who wants to use this data, the data is there.
33:07 It's publicly accessible.
33:08 And if you need a place to compute from that's in Azure, so close to the data and you don't already have an Azure subscription, then you can sign up for a planetary computer account.
33:18 And so like that's a way lower bar of barrier to entry.
33:21 There is you just sign up for an account, you get approved by us and then you're off to the races.
33:26 That's a great point.
33:27 If you think you need a grant to if you think you need a grant to use the cloud, try using the planetary computer first because you might not.
33:33 Yeah, very good.
33:33 Talk Python To Me is partially supported by our training courses.
33:38 When you need to learn something new, whether it's foundational Python, advanced topics like async or web apps and web APIs, be sure to check out our over 200 hours of courses at Talk Python.
33:50 And if your company is considering how they'll get up to speed on Python, please recommend they give our content a look.
33:56 Thanks.
33:56 So what's the business model around this?
34:02 Is there going to be a fee for it?
34:04 Is there some free level?
34:05 Is it always free, but restricted how you can use it?
34:08 Because right now it's in like a private beta, right?
34:11 I can come down and request access to it.
34:12 Yeah, it's a preview.
34:13 We're still like getting access by requiring requests.
34:17 And, you know, there's a larger number of requests we're approving over time.
34:21 We're still coming up with the eventual final sort of target.
34:25 Most likely it will be some sort of limits around what you can do as far as compute, as far as data storage, once we have features around that.
34:35 And with clear offboarding of like if you're an enterprise organization that wants to utilize this technology, there should be paid services that allow you to just as easily do it as you're doing on the planetary computer.
34:48 But if you're doing low usage use cases or if your use cases is super environmental sustainability focused and you apply for a grant, we could end up, you're still using a paid service, but we're covering those costs through our grants program.
35:04 So we're still figuring that out as far as, you know, we're not, I don't see this as something that we're, you know, trying to turn into a paid service necessarily.
35:12 I think that there's a number of, you know, enterprise level services that could end up, you know, looking a lot like the planetary computer.
35:19 But really, we want to continue to support uses, particularly for environmental sustainability use cases through this avenue.
35:28 Yeah.
35:29 One of the nice things about our overall approach is since we're so invested in the open source side of things is if we're, you know, you might have requested an account a while ago and we're like very slowly going through them because there's just like so much to do.
35:42 But if we're too slow approving your account, then you can replicate the hub in your own Azure subscription.
35:48 If we're blocking you or if your needs are just like so vastly beyond what we can provide within this one subscription, then you can go ahead and do your own setup on Azure and get access to our data from your own subscription.
36:02 Right.
36:02 Because the blob storage is public, right?
36:05 Exactly.
36:06 Yep.
36:06 Okay.
36:07 Yeah.
36:07 Very nice.
36:08 Maybe the next two things to talk about are the API and the hub, but I think maybe those would be good to see together.
36:16 What do you think?
36:17 Yeah.
36:17 Yeah, definitely.
36:18 I think I'll let you talk us through some scenarios here, Tom.
36:21 Cool.
36:22 Yeah.
36:22 So I'm, in this case, I've, you know, logged into the hub here.
36:25 So I've, this is a, yeah.
36:28 Before you go further, there is a choice you get when you go there.
36:32 You've got an account and you click start my notebook up.
36:35 Yeah.
36:35 It's actually going to fire up a machine and it gives you four choices, right?
36:38 Python with four cores and 32 gigs of memory and a Pangeo notebook.
36:43 It gives you R with eight cores and R geospatial and GPU PyTorch, as well as UGIS, which I don't really know what that is.
36:51 Maybe tell us about getting started.
36:53 Yeah.
36:54 Got it.
36:54 So this is a Jupyter Hub deployment.
36:57 So Jupyter Hub's this really nice project.
36:59 I think it came out of UC Berkeley when they were kind of teaching classes, data science courses to like thousands of students at once.
37:07 And, you know, even with like Condor or whatever, you don't want to be trying to manage a thousand students, Condor installations or whatever.
37:16 So that's just a nightmare.
37:18 So they had this kind of cloud-based setup where you just log in with your credentials or whatever, and you get access to a compute environment to do your homework in that case or do your geospatial data analysis in this case.
37:31 And so this kind of, you mentioned Pangeo, this is this ecosystem of geobusinesses, geoscientists who are trying to do scalable geoscience on the cloud that Anaconda was involved with.
37:43 And so they kind of pioneered this concept of a Jupyter Hub deployment on Kubernetes that's tied to Dask.
37:51 So you can create, easily get a single node compute environment here, in this case, he's in the Python environment, or multiple nodes, a cluster of machines to do your analysis using Dask and Dask gateway.
38:03 Yeah, it's just a Kubernetes-based computing environment.
38:07 That's cool.
38:08 And I noticed right away the Dask integration, which is good for like this massive amount of data, right?
38:13 Because it allows you to scale across machines or, you know, more stream data where you don't have enough to store it, memory and things like that.
38:19 Yeah, exactly.
38:20 So this is a great thing that we get for Python.
38:23 So Dask is Python-specific.
38:24 We do have the other environments like R for, if you're doing geospatial in R, which there's a lot of really great libraries there, that's an option.
38:33 That is, unfortunately, single node.
38:36 There's not really a Dask equivalent there.
38:38 But there's some cool stuff that's being worked on, like multi-D plier and things like that.
38:43 Cool.
38:44 And if people haven't seen Dask running in Jupyter Notebook, there's the whole cluster visualization.
38:49 And the sort of progress computation stuff is super neat to see it go.
38:53 Yeah.
38:53 Yeah.
38:54 So it's when you're doing these distributed computations, it's really key to have an understanding of what your cluster's up to.
39:01 It's just crucial to be able to have that information there.
39:05 And then the example code that you've got there, the cloudless Mosaic Sentinel-2 notebook, it just has basic create me a cluster in Dask, get the client, create four to 24 workers, and then off it goes, right?
39:22 Yeah, exactly.
39:24 What is the limits and how does that work, right?
39:26 As part of getting an account on there, you get access to this cluster?
39:30 Yep.
39:30 So this is the first thing that we've talked about today that does require an account.
39:33 So the hub requires an account, but accessing the Stack API, which we'll see in a second, and even downloading the data does not require an account.
39:41 You can just do that anonymously.
39:42 Yeah, and in this case, I think the limit's like a thousand cores, something like that, some memory limit as well.
39:50 So that's the limit that you're into there.
39:53 So you can get quite a bit out of this.
39:55 That's real computing right there.
39:57 Yeah, definitely.
39:58 And in this case, we're using Dask's adaptive mode.
40:02 So we're saying, right now there's nothing to do.
40:05 It's just sitting around idly.
40:06 So I have three or four workers.
40:08 But once I start to actually do a computation that's using Dask, it'll automatically scale up in the background, which is a neat feature of Dask.
40:16 Yeah, and so the basic computation, the problem that we're trying to do here is we have some area of interest, which I think is over Redmond, Washington, Microsoft headquarters, which we're defining as this.
40:26 It's an exact square, yeah.
40:28 Yeah, maybe.
40:28 Heck.
40:29 Yeah, some sort of, I think it's a square polygon.
40:32 Anyway, we draw that out and then we say, okay, give me all of the Sentinel-2 items that cover that area.
40:41 So again, back to what we were talking about at the start is like, if you just had files in blob storage, that'd be extremely difficult to do.
40:48 But thanks to this nice stack API, which we can connect to here at planetarycomputer.micsop.com, we're able to quickly say, hey, give me all the images from 2016 to 2020 from Sentinel that cover, that intersect with our area of interest here.
41:04 And we're even throwing in a query here saying, hey, I only want scenes where the cloud cover is less than 25%, according to the metadata.
41:13 Very likely summer in Seattle because the winter, not so much.
41:17 Much fewer.
41:18 Yeah, much fewer.
41:18 So, you know, quickly within a second or two, we get back the 138 scenes items out of the, I don't know how many there are in total, but like hundreds of thousands, millions of individual stack items that comprise.
41:33 20 million?
41:34 20 million.
41:34 Okay.
41:35 That comprise Sentinel-2.
41:36 So we're quickly able to filter that down.
41:39 Next up, we have a bit of signing.
41:40 So this is that bit that we talked about where you can do all this anonymous, but in order to actually access the data, we have you sign the items, which basically appends this little token to the URLs.
41:51 And then at that point, they can be opened up by any geospatial program like QGIS or...
41:58 Right.
41:58 It converts a private block storage URL to a temporary public one.
42:02 Yep.
42:03 Exactly.
42:03 Exactly.
42:04 So you do that.
42:05 It's just like this kind of incidental happenstance that stack and dask actually pair extremely nicely.
42:12 If you think about dask, the way it operates is it's all about lazily operating, lazily constructing a task graph of computations.
42:20 And then at the end of your whatever you're doing, computing that all at once.
42:26 That just gives really nice rooms for optimizations and maximizing parallelization wherever possible.
42:31 The thing about geospatial is, again, if you didn't have stack, you'd have to open up these files to understand where on earth is it?
42:40 What latitude, longitude does it cover?
42:43 Right.
42:43 You have to open up all 20 million files and then look and see what its metadata says in it, right?
42:47 Yeah.
42:48 Okay.
42:48 And in this case, we have like 138 times three files.
42:52 Those 600, you know, whatever, 450, 600 items files here.
42:56 You know, each opening, each one of those takes a few, maybe 200, 400, 500 milliseconds.
43:01 So it's not awful, but it's like too slow to really do interactively on any scale of any large number of stack items.
43:11 So that's where it stacks great.
43:13 It has all the metadata.
43:14 So we know that this TIFF file, this cloud-optimized geotiff file that contains the actual data, we know exactly where it is on earth.
43:22 What latitude, longitude it covers, what time period it covers, what asset it actually represents wavelength.
43:27 So we're able to very quickly stack these together into this X-ray data array.
43:32 That's in this case, it's fairly small since we've chopped it down.
43:36 If we leave out the filtering, it'd be much, much larger because these are really large scenes.
43:41 But anyway, we're able to really quickly generate these data arrays.
43:45 And then using Dask, using our Dask cluster, we can actually load those, persist those in distributed memory on all the workers on our cluster.
43:53 So that's like very easy.
43:56 It's like a few lines of code, a single function call, but it represents years of effort to build up these stack specification and all the metadata and then the integration into Dask.
44:07 So it's just a fantastic, fantastic result that we have.
44:10 Yeah, and it's super cool.
44:11 Once you just call data.persist on the Dask array, you can just see in the dashboard of Dask, like all these clusters firing up and all this data getting processed.
44:24 Yeah, very neat.
44:25 Yeah, exactly.
44:26 So in this case, since we have that adaptive mode, we'll see additional workers come online here.
44:31 As we start to stress the cluster, it's saying, oh, I've got a bunch of unfinished tasks.
44:35 I should bring online some more workers.
44:38 And that'll take either a few seconds if there's empty space on our cluster or a bit longer.
44:43 Yeah, I feel like with this, if it just sat there and said, it's going to take two minutes and just spun with a little star, the Jupyter star, that would be boring.
44:51 It has this cool animated little dashboard like, oh, I'm going to just watch it go.
44:54 Look at it go.
44:55 No.
44:56 It's kind of like defragging your hard dive with the old days.
44:58 It's just you watch these little bars go across.
45:01 It's very bizarre.
45:01 Bizarrely satisfying.
45:03 Yeah, I will definitely just spend some time sitting here watching it.
45:06 Essentially, like monitoring.
45:08 There's like a lot of communication here.
45:10 There shouldn't be, but really, I'm just watching the lines move.
45:14 While the thing is working, let me take a question from the live stream.
45:17 Sam Paria asks, can users bring their own data to this sort of processing or, you know, because you've got the data sets that you have.
45:25 Is there a way to bring other research data over?
45:28 Yeah.
45:28 So the answer now is like, yes, but you kind of have to do a lot of effort to get it there.
45:35 Like, so your own data, you probably, maybe you do have like your own stack API and database setup and all of that.
45:43 But that's publicly accessible or you have a token for.
45:46 So most users don't already have that.
45:48 So you can't, this real divide between the data sets that we provide with our nice stack API and like your own custom data set.
45:56 That might be a pile of files and blob storage.
45:58 And you could access it that way, certainly.
46:00 But there's kind of a divide there.
46:02 So that is definitely something that we're interested in improving is making user data sets like that are private to you feel as nice to work with as our own public data sets.
46:12 Yeah.
46:12 Another thing that I saw when I was looking through, it said, under the data sets available, it says, or if you have your own data and you'd like to contribute, contact us.
46:20 And that's a slightly different question than they were just asking.
46:23 That's the one question was, well, I have my own data.
46:25 I want to use it.
46:26 This is like how I've, I work at a university or something.
46:29 I've got all this data.
46:30 I want to make it available to the world.
46:31 What's the story of that?
46:32 We have a backlog of data sets that we're onboarding onto Azure Blob Storage and then importing into the API.
46:39 We're still working through that backlog, but always on the lookout for good data sets that have real use cases in environmental sustainability.
46:46 If there's, you know, a group that's doing some research or doing building applications that have environmental sustainability impact and they need a data set, that certainly bumps it up on our list.
46:56 So, yeah, I would love to hear from anybody that has data sets that you're looking to expose publicly, hosts on the Planetary computer for anybody to use and need a place to host it.
47:05 Yeah, very cool.
47:06 All right, Tom, your graph stopped moving around.
47:08 It might be done.
47:09 Yeah, so we spent quite a while loading up the data and then that's like, yeah, just how it goes.
47:15 You spend a bunch of time loading up data and then once it's in memory, computations tend to be pretty quick.
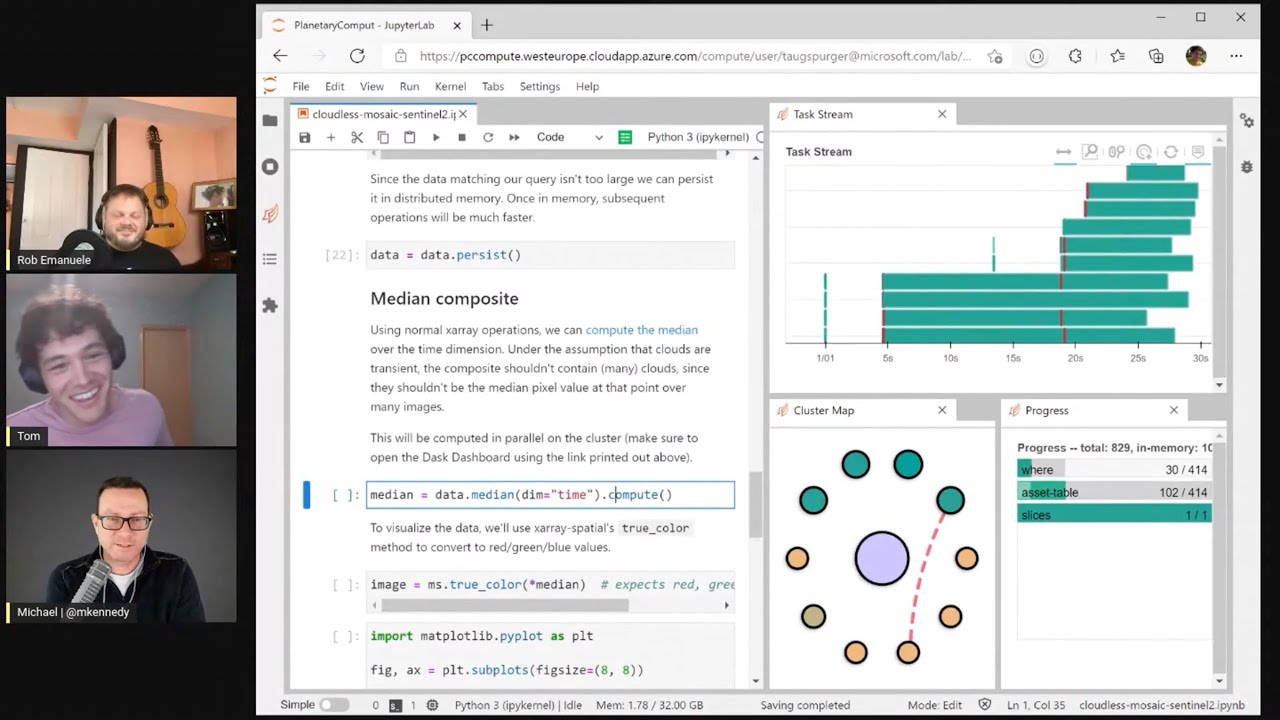
47:20 So in this case, we're taking a median over time.
47:23 Is this the median of the image?
47:25 What is that a median of?
47:27 Yeah, so right now we have for like a list of numbers.
47:29 I'm not sure what it means for an image.
47:31 Yeah, so this is a median over time.
47:32 So our stack here, our data arrays, a four-dimensional array and the dimensions are time, first of all.
47:39 So we had like 138 time slices, wavelength.
47:42 So these, you know, red, green, blue, near-infrared, Sentinel captures like 10 or 12 wavelengths and then latitude and longitude.
47:51 So we took the median over time.
47:55 And the idea here is that like stuff like roads and mountains and forests tend not to move over time.
48:03 They're static relatively compared to something like clouds.
48:06 So again, clouds are always a problem.
48:08 And once you take the median over time, you kind of get like the average image over this entire time period, which turns out to be an image that doesn't have too many clouds in it.
48:19 Yeah, it might have no clouds because if you kind of averaged them out across all of them because you already filtered it down pretty low.
48:24 Yeah.
48:25 Yeah.
48:25 So now we can see a picture of the Seattle area where it's a cloud-free composite or a cloudless mosaic.
48:31 Yeah, beautiful.
48:31 Looks like you got maybe that's, what is that, Lake Washington and you got Rainier there and all sorts of good stuff.
48:38 Yeah.
48:38 Yeah.
48:39 I'm sure I actually do not know the geography of that well, but I have been looking at lots of pictures.
48:44 We tend to use this as our example area a lot.
48:47 Yeah.
48:48 Super cool.
48:48 Anyway, and one nice thing here is like, so we're, again, investing heavily in open source, investing in building off of open source.
48:57 So we have like all the power of Xarray to use.
49:00 Xarray is this like very general purpose, in-dimensional array computing library.
49:05 It kind of combines the best of NumPy and pandas.
49:07 In this case, you know, we can do something like group by.
49:10 So if you're familiar with pandas, you're familiar with group bys, we can group by a time dot month.
49:14 So I want to do like a monthly mosaic.
49:16 Maybe I don't want to combine images from January, which might have snow in them with images from July, which wouldn't have as much.
49:23 So I can do a.
49:24 So you'll get like 12 different images or something like that.
49:27 Here's what it kind of averaged out to be in February.
49:30 Exactly.
49:31 And so now we have a stack of images, 12 of them, and we can go ahead and representing a median.
49:37 So we have multiple years and we group all of the ones from January together and take the median of those.
49:43 And then we get a nice little group of cloud free mosaics here, one for each month.
49:48 Yeah.
49:48 And sure enough, there is a little less snow around Rainier in the summer than in the winter as you would, you know, the cascades.
49:53 Yep, definitely.
49:54 So that's like a fun little introductory example to what the hub gives you.
49:59 It gets you the single node environment, which that alone is quite a bit.
50:03 You know, you don't have to mess with, you know, fighting to get like the right set of libraries installed, which can be especially challenging when you're interfacing with like the C and C++ libraries like GDAL.
50:13 So that environment is all set up, mostly compatible, should all work for you on a single node.
50:18 And then if you do have these larger computations, you know, we saw it took a decent while to load the data, even with these fast interop between the storage machines and the compute machines in the same Azure region.
50:29 But you can scale that out on enough machines that your computations complete in a reasonable amount of time.
50:34 Yeah.
50:34 And because the animations, I don't need, you don't even mind.
50:37 Now it's, it's super cool.
50:38 So you use the API to really narrow it down from 20 million to like 150 or 138 images and then keep, keep running on.
50:46 So one thing that I was wondering when I was looking at this is, you know, what libraries come included that I can import and which ones, you know, if there's something that's not there, maybe I really want to use HTTPX and you only have requests or whatever.
51:00 Like, is there a way to git additional libraries and packages and stuff in there?
51:03 We do have a focus on geospatial.
51:06 So that's like, we'll have most of that there already.
51:09 So, you know, XRA, Dask, Rasterio and all those things.
51:13 But if there is something there, our container.
51:16 So these are all Docker images built from Conda environments.
51:19 That's all comes from this repository, Microsoft slash planetary computer containers.
51:24 So if you just, you know, you want HTTPX, you add it to the environment.yaml and we'll get a new image built and then available from the planetary computer.
51:33 And so these are public images.
51:35 They're just on the Microsoft container registry.
51:38 So if you want to, you know, we use our image, like you don't want to fight with getting a compatible version of, say, PyTorch and lib JPEG.
51:47 Not that I was doing that recently, but if you want to, if you want to avoid that pain, then you can just use our images locally, like from your laptop.
51:55 And you can even like connect to our Dask gateway using our images from your local laptop and do like some really fun setups there.
52:02 Yeah, I see.
52:03 Because most of the work would be happening in the clusters, the Dask clusters, not locally anyway.
52:08 Yeah.
52:08 So all the compute happens there and then you bring back this little image that's your plot, your result.
52:13 Okay.
52:13 Yeah, very cool.
52:14 So how do I get mine in here?
52:16 Like I see the containers.
52:18 I see you have the last commit here.
52:20 Yeah.
52:20 So there's one per, one per.
52:22 Right now, honestly, the easiest way is to send me, you know, open up an issue and I'll take care of it for you.
52:27 I see.
52:27 Just because I haven't got this continuous deployment quite working out.
52:30 There's an environment, you know, DIMO file there.
52:33 That gets.
52:33 Oh, yeah.
52:34 So you go see, yeah, there's quite a few packages in here already.
52:37 Yep.
52:38 And those are just the ones we explicitly asked for.
52:40 And then all their dependencies get pulled into a lock file and then built into a Docker images.
52:45 And so this is building off a project from Pangeo, that group of geo scientists that I mentioned earlier, who have been struggling with this problem for several years now.
52:54 So they have a really nice Docker eyes set up.
52:57 Right.
52:57 And we're just building off that base image.
52:59 Cool.
52:59 Yeah.
52:59 Based on the Pangeo container.
53:01 Very cool.
53:02 Sam Aparia asks, how long is the temporary URL active for the signed URL, the blob storage?
53:08 So that actually depends on whether or not you're authenticated.
53:12 We have some controls to say the planetary computer hub requires access, but also you get an API token, which gives you a little bit longer lasting tokens.
53:21 But forget what the actual current expiries are.
53:25 If you use the planetary computer Python library, you just pip install planetary underscore computer and use that dot sign method, it will actually request a token.
53:35 And then as the token is going to expire, it requests a new token.
53:40 So it reaches the token and caches it.
53:43 But it should be long enough for actually pulling down the data files that we have available.
53:49 Because we're working against smaller cloud optimized formats.
53:54 There aren't these 100 gig files that you should have to pull down and need a single SAS token to last for a really long time.
54:01 So you can re-request if you need a new one as it expires.
54:04 And like I said, that library actually takes care of the logic for you there.
54:08 That's cool.
54:09 Yeah, very nice.
54:10 All right, guys.
54:10 Really good work with this.
54:12 And it seems like it's early days.
54:14 It seems like it's getting started.
54:16 There's probably going to be a lot more going on with this.
54:17 Yeah, for sure.
54:18 I'm going to go out on a limb and make a big prediction that understanding the climate and climate change is going to be more important, not less important in the future.
54:26 So I suspect that's also going to grow some interest.
54:29 It might.
54:29 It might.
54:30 It might.
54:30 You know, the new report at PCC is making some heavy predictions.
54:36 And, you know, within the decade, you know, we might reach, you know, plus 1.5 Celsius.
54:41 And, you know, we're already in it.
54:44 We're already feeling the effects.
54:45 And, you know, this is the data about our Earth.
54:48 And it's going to become more and more important as we mitigate and adapt to these effects.
54:54 So, yeah, I agree.
54:55 I think that's a good question.
54:56 Yeah, if we, thanks.
54:57 If we are going to plan our way out of it and plan for the future and, you know, science our way out of it, we're going to need stuff like this.
55:05 So, well done.
55:06 All right.
55:06 I think we're about out of time.
55:07 So let me ask you both the final two questions here.
55:10 If you're going to write some Python code, what editor do you use?
55:13 Rob?
55:14 VS Code.
55:14 I suspect I could guess that, but yeah.
55:17 Yeah, actually, I was a big Emacs user.
55:19 And then when I got this job, switched over to VS Code.
55:23 It just integrated better with Windows.
55:25 And then really got into the PyLance and the typing system, you know, doing type annotations and basically having a compiler for the Python code.
55:33 Like really a change.
55:34 Instead of having all of the types in my head and having to like worry about all that, actually having the type hinting.
55:40 Yeah.
55:40 It was something I wasn't doing a year ago.
55:42 And now it's like drastically improved my development experience.
55:46 It's a huge difference.
55:48 Yeah.
55:48 And I'm all about that as well.
55:49 People talk about the types being super important for things like mypy and other stuff.
55:55 And, you know, in a lot of cases it can be.
55:57 But to me, the primary use case is when I hit dot after a thing, I wanted to tell me what I can do.
56:02 And if I have to go to the documentation, then it's kind of like something is failing.
56:07 I shouldn't need documentation.
56:08 I should be able to just, you know, auto complete my way through the world mostly.
56:11 Totally.
56:12 And I come from a, I was a Scala developer for, you know, six, about six years.
56:18 So I was used to very heavy, heavily typed system and kind of got away with it from Python.
56:23 I was like, you know what?
56:24 I like that there's not types, but I feel like the Python ecosystem is really hitting that sweet spot of like introducing enough typing, which is really great.
56:32 And then the inference flies along for the rest of the program.
56:35 Yeah.
56:35 Totally.
56:35 Yeah.
56:36 All right, Tom, how about you?
56:37 VS Code as well for most stuff.
56:39 And then Emacs for Magit, Magit, the Git client, and then a bit of Vim every now and then.
56:45 Right on.
56:46 Very cool.
56:46 Yeah.
56:47 All right.
56:47 And then the other question is for either of you, there's like a cool, notable IPI or Conda package that you're like, oh, I came across this.
56:56 It was amazing.
56:57 People should know about it.
56:58 Any ideas?
56:58 Have you got one?
56:59 Sure.
56:59 I'll go for Seaborn.
57:01 It's a plotting library from Michael Wascom built on top of Matplotlib.
57:06 It's just really great for exploratory data analysis.
57:09 Easily create these great visualizations for mostly tabular data sets, but not exclusively.
57:15 Oh, that's interesting.
57:16 I knew Seaborn.
57:16 I knew Matplotlib.
57:17 I didn't realize that Seaborn was like, let's make Matplotlib easier.
57:20 Yeah.
57:21 Essentially, for this very specific use case, Matplotlib is extremely flexible, but there's a lot of boilerplate and Seaborn just wraps that all up nicely.
57:29 Yeah.
57:30 Super cool.
57:31 All right.
57:31 Well, thank you so much for being here.
57:33 Final call to action.
57:34 People want to get started with Microsoft Planetary Computer.
57:36 Maybe they've got some climate research.
57:38 What do they do?
57:39 Planetarycomputer.microsoft.com.
57:41 That'll get you anywhere you need to go.
57:43 And then if you want an account, then it's slash account slash request, I believe.
57:47 Yeah.
57:47 There's a big request access right at the top.
57:50 So you can click that.
57:51 Awesome.
57:51 Yeah, exactly.
57:52 All right.
57:52 Rob, Tom, thank you for being here.
57:54 And thanks for all the good work.
57:55 Thanks for having us.
57:56 This is great.
57:56 Awesome.
57:57 Thanks so much.
57:57 Yeah.
57:58 Bye.
57:58 See ya.
58:00 This has been another episode of Talk Python To Me.
58:03 Our guests on this episode were Rob Emanuel and Tom Augsberger.
58:07 And it's been brought to you by Shortcut, formerly Clubhouse I.O., us over at Talk Python Training,
58:12 and the transcripts were brought to you by Assembly AI.
58:14 Choose Shortcut, formerly Clubhouse I.O., for tracking all of your project's work.
58:20 Because you shouldn't have to project manage your project management.
58:23 Visit talkpython.fm/shortcut.
58:26 Do you need a great automatic speech-to-text API?
58:29 Get human-level accuracy in just a few lines of code.
58:31 Visit talkpython.fm/assembly AI.
58:34 Want to level up your Python?
58:37 We have one of the largest catalogs of Python video courses over at Talk Python.
58:40 Our content ranges from true beginners to deeply advanced topics like memory and async.
58:45 And best of all, there's not a subscription in sight.
58:48 Check it out for yourself at training.talkpython.fm.
58:51 Be sure to subscribe to the show, open your favorite podcast app, and search for Python.
58:56 We should be right at the top.
58:57 You can also find the iTunes feed at /itunes, the Google Play feed at /play,
59:02 and the direct RSS feed at /rss on talkpython.fm.
59:07 We're live streaming most of our recordings these days.
59:10 If you want to be part of the show and have your comments featured on the air,
59:13 be sure to subscribe to our YouTube channel at talkpython.fm/youtube.
59:17 This is your host, Michael Kennedy.
59:19 Thanks so much for listening.
59:21 I really appreciate it.
59:22 Now get out there and write some Python code.
59:24 Now get out there and write some Python code.
59:24 Thank you.
59:25 Thank you.