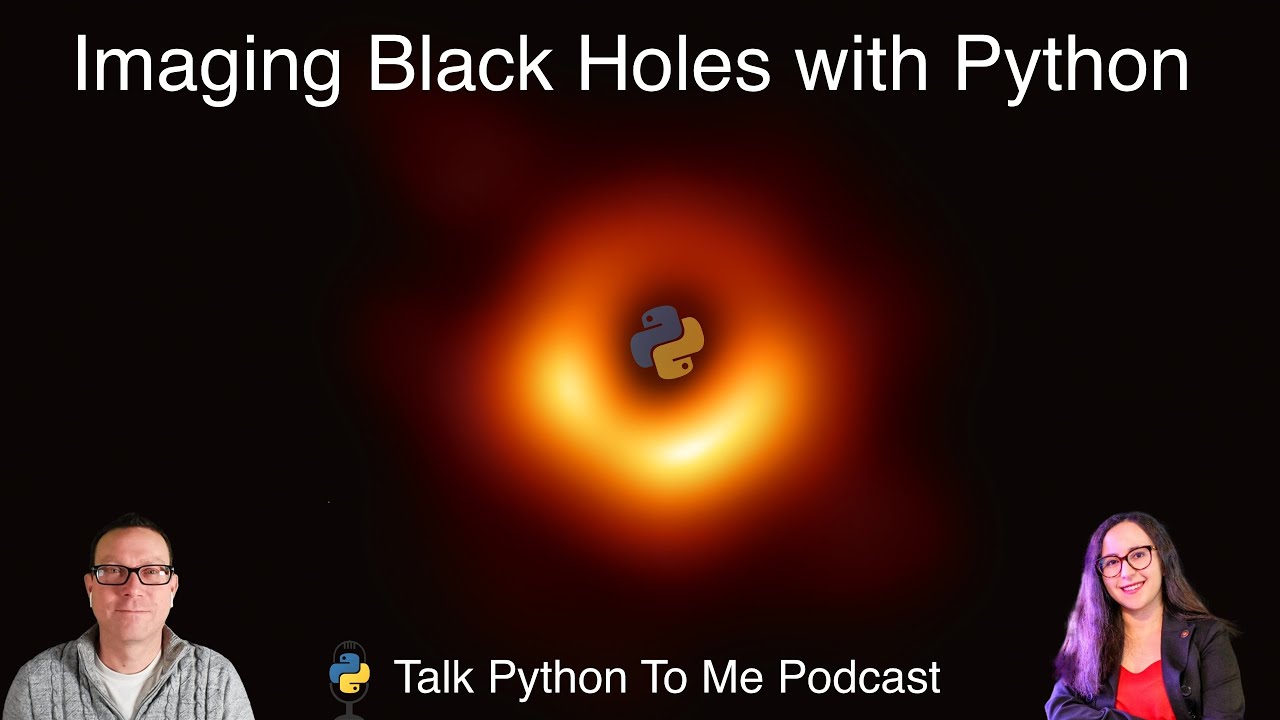
Imaging Black Holes with Python


Episode Deep Dive
Guests Introduction and Background
Dr. Sarah Issaoun is an astrophysicist who works with the Event Horizon Telescope (EHT) collaboration—the global team that created the first direct image of a black hole, famously released in 2019. She has been deeply involved in calibrating and interpreting the petabytes of data that made capturing the M87 black hole possible. Her background spans physics, astronomy, and significant hands-on work with Python and open-source tools to analyze and visualize some of humanity’s most remarkable astronomical data.
What to Know If You're New to Python
If you're just getting started with Python and want to follow along with the big ideas from this episode, it helps to have a basic understanding of:
- Variables, loops, and functions so you can follow how data calibration is automated.
- Simple data structures (lists, dictionaries) as these were used in post-processing steps (e.g., using
pandas). - Basic plotting techniques (e.g.,
matplotlib) for visualizing data and images. - Reading / writing files since massive amounts of telescope data were shipped on hard drives before being processed.
Key Points and Takeaways
- Black Hole Imaging and Python’s Central Role
The iconic image of the M87 black hole was compiled through data captured around the globe and processed largely with Python. While lower-level data-crunching used Fortran or C, Python provided a critical layer for calibration, analysis, and visualization. This demonstrates how scientific research, especially in astronomy, embraces Python’s ecosystem for rapid, flexible data handling.
- Links and Tools:
- matplotlib.org (Data plotting)
- pandas.pydata.org (Data analysis)
- Links and Tools:
- Earth-Sized “Telescope” via Interferometry
The Event Horizon Telescope technique is based on radio interferometry—coordinating remote radio dishes from places like the South Pole, Hawaii, and Chile to function as a planet-wide observatory. Each telescope’s data is time-stamped with atomic clocks and combined later to synthesize one massive “virtual” telescope.
- Links and Tools:
- eventhorizontelescope.org (Project details)
- Links and Tools:
- Shipping Petabytes of Data on Hard Drives Internet transfers aren’t feasible for such huge data sets—especially from remote locations like the South Pole. Disks are physically shipped and later combined at correlation centers (MIT Haystack and Max Planck Institute). A color-coded system (green vs. red stickers) tracks full vs. empty drives, an amusing but essential detail of practical data logistics.
- Data Calibration: A Blend of Fortran, C, and Python
The raw data (radio signals mixed with atmospheric noise) are converted into meaningful complex visibilities. Heavy lifting occurs in supercomputers running Fortran and C, but Python-based post-processing steps—especially using pandas—tame and structure the data for quick iteration, corrections, and final analysis checks.
- Links and Tools:
- Independently Reconstructing the Black Hole Image
Multiple teams used distinct imaging algorithms and parameter choices, yet they arrived at the same ring-like image for M87. This cross-verification—independent “blind” imaging attempts—ensured high confidence that the bright ring and central shadow are no artifact of any single technique.
- Links and Tools:
- Dynesty (Nested sampling library mentioned for modeling)
- Links and Tools:
- Astronomical Significance of M87 and Sagittarius A*
M87, 55 million light-years away, has a black hole 6.5 billion times the mass of our Sun. Conversely, our own galaxy’s Sagittarius A* is less massive but shows a similar ring and shadow structure. Comparing these two black holes reveals that extreme gravity and relativistic effects dominate at this scale, regardless of galaxy type.
- Links and Tools:
- NASA press releases for more black hole discoveries
- Links and Tools:
- Validating Einstein’s General Relativity
The EHT observations are consistent with Einstein’s predictions. The black hole’s size and the circular shape of its shadow fit well with general relativity. While some alternative theories have been ruled out, stronger or sharper images in the future might reveal new subtleties.
- Links and Tools:
- Einstein Online (General relativity resources)
- Links and Tools:
- Open-Source Community Importance
Python’s open-source libraries (e.g., matplotlib, pandas) and broader scientific ecosystem are crucial for astronomers who need fast, flexible, and communal development. Dr. Issaoun highlights that open-source contributions underlie many breakthroughs in science, saving enormous time and resources.
- Links and Tools:
- matplotlib.org
- pypi.org (Python package index)
- Links and Tools:
- Public Impact and Popular Culture
The black hole image was so compelling it appeared on front pages globally, trended #1 on social media, and sparked countless memes. This broad public fascination highlights how big science projects can inspire diverse audiences—from hardcore astronomers to casual observers.
- Links and Tools:
- Breakthrough Prize (Awarded to EHT team)
- Links and Tools:
- Next Generation EHT and Future Plans More telescopes and faster observation cycles are in development. Longer-term visions include space-based radio observatories that bypass atmospheric limitations. Future expansions aim at creating black hole “movies,” revealing rotating accretion disks and possibly more black hole shadows in other galaxies.
- Links and Tools:
- eventhorizontelescope.org/blog (Updates on future arrays)
Interesting Quotes and Stories
- “We got a lot of traction from our matplotlib press.” – Reflecting the surprising attention from developers who recognized Python’s plotting library behind the black hole’s reveal.
- Data Shipping Adventures: Don Souza’s story as an ex-police officer turned shipping logistics expert for the EHT underscores the unexpected complexities in high-stakes science.
Key Definitions and Terms
- Event Horizon: The “point of no return” around a black hole where not even light can escape.
- VLBI (Very Long Baseline Interferometry): A technique using multiple radio telescopes to simulate one giant telescope by combining signals with precise timing.
- Complex Visibilities: Radio signal data with amplitude and phase, crucial for reconstructing images from multiple telescopes.
Learning Resources
- Python for Absolute Beginners (talkpython.fm): Ideal for those who want a structured guide to Python basics and beyond.
- Python Data Visualization (talkpython.fm): Learn to create interactive and sophisticated plots—an essential skill for astronomical data and beyond.
Overall Takeaway
Imaging a black hole was a monumental achievement: It required novel scientific collaboration, a planet-scale telescope, and immense data-processing logistics. Python’s open-source tools proved indispensable for calibrating, analyzing, and visualizing the data that led to the now-famous black hole “ring.” Looking forward, ever-expanding telescope arrays and advanced Python-driven techniques promise to uncover even more about our universe, testing fundamental physics and capturing the public’s imagination on a cosmic scale.
Links from the show
Sara on Twitter: @saraissaoun
Event Horizon Telescope: eventhorizontelescope.org
Black Hole Image Makes History; NASA Telescopes Coordinated Observations: nasa.gov
Event Horizon Data: eventhorizontelescope.org
Imaging, analysis, and simulation software for radio interferometry Package: github.com
Initial data showing ring (matplotlib) (video at time): youtube.com
Mars 2020 Helicopter GitHub Badge: github.blog
Watch this episode on YouTube: youtube.com
Episode #398 deep-dive: talkpython.fm/398
Episode transcripts: talkpython.fm
---== Don't be a stranger ==---
YouTube: youtube.com/@talkpython
Bluesky: @talkpython.fm
Mastodon: @talkpython@fosstodon.org
X.com: @talkpython
Michael on Bluesky: @mkennedy.codes
Michael on Mastodon: @mkennedy@fosstodon.org
Michael on X.com: @mkennedy
Episode Transcript
Collapse transcript
00:00 The iconic and first-ever image of a black hole was recently released.
00:03 It took over a decade of work and is a major achievement for astronomy and broadens our understanding of the universe for all of us.
00:10 Would it surprise you to know that Python played a major part in this discovery?
00:14 Of course it did, and Dr. Sarah Eisen is here to give us the full story.
00:18 This is Talk Python To Me, episode 398, recorded December 12, 2022.
00:24 Welcome to Talk Python To Me, a weekly podcast on Python.
00:41 This is your host, Michael Kennedy.
00:43 Follow me on Mastodon, where I'm @mkennedy, and follow the podcast using @talkpython, both on fosstodon.org.
00:50 Be careful with impersonating accounts on other instances.
00:53 There are many.
00:54 Keep up with the show and listen to over seven years of past episodes at talkpython.fm.
00:59 We've started streaming most of our episodes live on YouTube.
01:03 Subscribe to our YouTube channel over at talkpython.fm/youtube to get notified about upcoming shows and be part of that episode.
01:10 This episode is brought to you by Cox Automotive.
01:14 Use your technical skills to transform the way the world buys, sells, and owns cars at talkpython.fm/cox and by Sentry.
01:22 Don't let those errors go unnoticed.
01:24 Get started at talkpython.fm/sentry.
01:29 Sarah, welcome to Talk Python To Me.
01:31 Thank you so much.
01:32 Thank you for having me.
01:33 Yeah, I'm very excited to have you on the show.
01:36 Ever since I saw that first picture of the black hole and heard the news,
01:41 I didn't know, but I thought, oh, there has to be some Python going on here, huh?
01:45 Oh, yeah, definitely.
01:45 We got a lot of traction from our Matplotlib press.
01:49 That's soon to catch the eye of many developers.
01:52 Oh, I see.
01:53 It is.
01:54 It is.
01:54 It is.
01:54 It is Python.
01:55 I see.
01:56 Look, there it is.
01:56 I know that theme.
01:57 That's right.
01:58 Yeah.
01:58 Yeah, absolutely.
01:59 So there's just many fascinating aspects of this.
02:03 The amount of data, the different data sources, the Earth scale telescope that you all created,
02:10 the processing with the pipeline, Python, and just seeing stuff 55 million light years away
02:17 at all, which is dark, is kind of crazy.
02:21 But before we get to all those fun topics, let's just hear your story.
02:25 How do you get into programming and into the Python side of these things?
02:29 And how do you get going to black holes, too?
02:31 Just to introduce myself.
02:32 Hello, everyone.
02:33 My name is Sarah.
02:34 I'm currently a member of the Event Horizon Telescope Project, the team that makes images
02:39 of black holes.
02:40 I've been interested in astronomy since I was a little kid.
02:43 Since I was eight years old, I got to, in second grade, I got to build a cardboard forward
02:48 system.
02:49 I'm sure everybody has kind of had similar experiences.
02:52 That was really my first kind of introduction into a world outside of our planet.
02:56 And I was just so fascinated by planets that I kind of binged through all of the astronomy
03:02 books I could find at my local library and fell in love with astronomy.
03:06 And so I ended up studying kind of the physical sciences.
03:09 I did a bachelor's in physics.
03:11 And because I was doing a bachelor's in physics, I didn't have astronomy courses as part of my
03:16 program.
03:16 So that was something that was pretty disappointing to me because I really wanted to do astronomy,
03:21 but I couldn't quite do that yet.
03:23 So as an undergrad, I decided to do a summer project in astronomy.
03:26 So I emailed a professor or a number of professors working in astronomy in the Netherlands.
03:31 And this professor responded a few minutes later to my email, which I sent during Christmas
03:37 holidays.
03:37 So I was very surprised that he'd respond.
03:40 And it turns out he said it was unusual for him to get emails from students wanting to do
03:44 work in the summer.
03:45 So he thought, oh, come on by.
03:47 I'll tell you about my project.
03:48 And he told me he was one of the big leads of this amazing adventure to take an image of
03:54 a black horse.
03:54 And I thought that was the coolest thing I'd ever heard.
03:57 And I kind of jumped right in and undergrad and then continued my master's and PhD with the project.
04:03 And I've been here ever since.
04:05 And so Python, I got introduced to Python in undergrad for programming, simple data analysis.
04:13 Although most of my undergrad was spent on C programming and MATLAB because it was very much
04:19 on the physics side.
04:20 And this is mostly what physicists use.
04:23 But then when I transitioned into an astronomy program in my master's and PhD, it was really
04:27 almost all Python.
04:28 And so that kind of was kind of learned by doing kind of training that I had to do.
04:34 I had to learn how to write.
04:35 I didn't take any Python classes, really.
04:37 Just kind of learn as I go with data processing analysis.
04:41 Ended up playing a big part in the EHT results.
04:44 And it really plays a big part in most astronomy data analysis lately.
04:48 It seems like it's just taken over that world recently, at least for the analysis side, right?
04:53 Maybe not running on devices, right?
04:56 There's probably, I don't think there's any Python running on, say, JWST.
04:59 But maybe some of the earthbound telescopes have some in play.
05:04 I don't know.
05:04 Yeah, a lot of the data processing and analysis is done in Python.
05:08 A lot of visualizations are also done in Pythons.
05:12 So it's become a very kind of versatile and flexible tool for us to quickly kind of make figures
05:18 for papers, as many people have noticed in our papers, our kind of major kind of matplotlib tools
05:25 that we use to display our data.
05:28 Exactly.
05:29 I think it's just completely taken over that space, which is really neat.
05:32 And I think the Python world is much better for having all of these scientists and folks
05:38 with other backgrounds using it for whatever they're interested in, right?
05:42 It's not just, well, here's how Instagram uses it.
05:45 And here's how this other API company uses it, right?
05:48 There's a much more diverse mosaic of interests and things people want from the language.
05:54 Absolutely.
05:55 I think one of the big strengths that we drew from Python was really the open source community.
06:00 There are many open source codes available that we were able to make use of in astronomy that
06:07 were not necessarily designed for astronomy data science purposes.
06:11 But that just happened to be really useful for what we were trying to do with the data.
06:15 And so it ended up saving us an enormous amount of time.
06:19 And so whenever we speak about our project, I tried to make a big point of saying that we do rely a lot on the open source
06:25 development community, which I think is a part of the developer community that is often overlooked.
06:31 And that is really important to support open source work because a lot of it is done by students and postdocs who are in the sciences, who just happen to need code to do a certain thing.
06:43 And they make it available.
06:44 And it turns out to have many different uses in other people's science.
06:48 And so we really build on the shoulders of all these people.
06:51 And it saves so much time.
06:52 Yeah.
06:53 Like Matplotlib or Pandas or a lot of these are general purpose, right?
06:58 Yeah.
06:58 So you gave a really great presentation, a keynote at PyCon 2022.
07:03 And I'll be sure to link that and we'll pull some ideas out of there.
07:07 Before we get to really into the programming and Python side of things, give us maybe just a little bit of history of black holes.
07:16 You know, a lot of this starts with Einstein, right?
07:19 And as soon as you see that dip, well, if there's enough gravity here, but what have you put more?
07:23 And what have you put more?
07:24 Like how steep can that curve get until it, then stuff falls into it and it gets steeper, right?
07:28 Like give us the history.
07:30 History starts, I think in the 1700s, even before Einstein.
07:34 There was this runner, Reverend Mitchell, who thought about this idea of, say, when you have kind of something trying to leave the Earth's gravity,
07:43 it has a specific escape speed in order to leave the Earth's gravity.
07:47 And no matter the size and weight of the object trying to leave, it always has the same escape speed because it depends on the gravity of the Earth.
07:55 So he thought what would happen if you would kind of make the Earth so heavy, so compact that the escape speed would become higher than the speed of light.
08:04 And so he thought he made this thought experiment and he found out that by having the speed being higher than the speed of light,
08:12 this star that you collapse ends up being dark because all of the light that is at its surface cannot escape.
08:19 So you can't see it anymore.
08:20 If it doesn't get to your eye, you cannot see it.
08:23 So you end up with a dark star.
08:25 And that was this kind of thought experiment that led to being a black hole.
08:29 This dark star is actually a black hole.
08:30 So even in the 1700s, you know, philosophers, you know, religious people like Reverend Mitchell thought about these ideas,
08:37 about what it could look like if you had such an object.
08:40 And these objects often seemed, well, this was just a thought experiment.
08:44 And then when Einstein came along, he tried to describe space and time and gravity in a single unifying theory and ended up the theory of general relativity.
08:52 That was in 1915 when he showed that light was actually affected by gravity so that light would bend around heavy objects because of this bend in the space time.
09:04 And then a year later, Carl Schwarzschild found the first kind of real solution to Einstein's theory, to Einstein's equations,
09:11 which ended up in what we call the singularity, which showed that there is this object that is kind of a hole in the space time.
09:19 And this object has a horizon, which we call the event horizon.
09:23 And the size of the horizon, the radius is called now the Schwarzschild radius after Carl Schwarzschild.
09:28 And it showed that anything that goes beyond this horizon can never come back because the escape speed at the horizon is the speed of light.
09:36 So anything that goes beyond would need an escape speed higher than the speed of light.
09:40 So, and light is the fastest thing that goes.
09:42 So nothing.
09:42 Circle around and just kind of just somehow, probably still move, but still be trapped within that space.
09:48 Exactly.
09:48 So you can never, once you cross that point, you can never come back.
09:52 And at that time, so people thought a lot about the theory of Einstein and this mathematical object that we call the singularity.
09:58 At the time they thought, okay, black holes are a mathematical object, but there's no way they could be real, right?
10:04 So people thought, okay, mathematically, that's so interesting, but these things can't exist in the universe.
10:09 And then in the 1930s, Chandrasekhar, famous Indian astronomer, he thought about the mass of stars.
10:16 So they're, you know, stars when they die, they become white dwarfs.
10:20 And so they die in these kind of stellar dead stars.
10:23 But then he thought, what about more massive stars?
10:25 Stars are much heavier.
10:26 It turns out that he calculated it and white dwarfs have a maximum mass.
10:31 So there are certain classes of heavier stars that could never end up as white dwarfs because they would collapse to something more massive than a white dwarf.
10:39 So it could not be a white dwarf.
10:40 And it turns out what they collapsed into is a black hole.
10:43 And this was the very first evidence that black holes could exist in reality, in the universe.
10:49 But they're kind of an inevitable endpoint for hemi stars.
10:53 But since then, people have been thinking about where to find them.
10:56 And people have been detecting these powerful streams of gas coming from centers of galaxies that could only be powered by a black hole.
11:03 And the galaxy M87, that's 55 million light years away from us, does have one of these big streams.
11:09 So that and that was the very first stream of gas from a center of a galaxy ever observed by humanity in 1980.
11:18 Didn't know that it was going to be a black hole at the time.
11:20 But then there was more and more evidence that the only thing that could really power this really powerful process had to be a black hole.
11:27 So we started then the story of trying to understand what they would look like from an observer point of view.
11:33 How big does the black hole have to be for us to be able to see it from Earth?
11:36 How big do we design a telescope that could see it?
11:39 And it turns out there are only two black holes in the sky that are reachable with the telescope the size of the Earth.
11:45 That's our maximum size that we could go.
11:47 And one is this black hole in M87, which we imaged in 2019.
11:51 And then the second one is our very own black hole in our Milky Way, Sagittarius star, which we imaged in 2022, just last May.
11:59 Oh, do you have pictures published of that?
12:01 Yeah, that's right.
12:02 It came out on May 12, 2022.
12:04 Yeah, just two weeks after my PyCon talk.
12:07 Oh, that's what I mean.
12:09 Yeah, it was frustrating not to be able to say anything.
12:13 So I kept telling people, you know, oh, please watch Earth news.
12:17 And we have exciting stuff coming.
12:19 But I couldn't say anything.
12:20 We have more pictures.
12:22 I'm sure.
12:22 I know.
12:23 I've seen them.
12:23 Yeah.
12:24 It's also worth pointing out this whole project that you were on.
12:27 It's a long running project.
12:28 Yes.
12:29 It went from when did it start?
12:31 I know.
12:31 Yeah.
12:32 Kind of the technology part started in the late 90s and then actually starting to add more and more
12:39 telescopes started in 2007.
12:40 So it is about a 10 year process between the first telescopes that joined and then the 2017 campaign in which we had finally enough telescopes to take the data to make images.
12:51 So about 10 years of building.
12:52 And we're still building.
12:54 We're still adding more telescopes.
12:55 We've added three more since then.
12:56 Yeah.
12:57 So this is called the Event Horizon Telescope.
13:00 And it's a planet scale telescope.
13:03 I mean, I just saw a whole bunch of news and cool pictures from JWST, James Webb Space Telescope.
13:09 Yeah.
13:10 It's huge, but it's only like 30, how many meters across?
13:14 30 feet?
13:15 Some number of meters?
13:16 12 meters?
13:17 I don't know.
13:17 It's not planet sized.
13:18 No.
13:19 How do you build a planet sized one?
13:22 We use a very clever trick that is called interferometry that actually won the Nobel Prize back in the 70s by Martin Ryle, who designed this technique.
13:32 And what we do is, in fact, it would be great to have a telescope the size of the Earth that we could build, like a giant Death Star in space that we could look at.
13:40 It would save us so much trouble.
13:42 But it turns out convincing funding agencies to give us that kind of money wasn't really possible.
13:48 So we had to use this clever technique of interferometry.
13:52 And what we do with our technique is we sync up telescopes that are at strategic locations around the Earth.
13:59 They have to observe at the exact same time.
14:01 And they're timed accurately by atomic clocks that are so precise, they lose about a second every million years.
14:07 And so these clocks time-
14:08 They're big too, right?
14:09 They're like-
14:10 They're not the size of a mini fridge.
14:12 Yeah.
14:12 Wow, okay.
14:13 Yeah.
14:13 They're big and they're very expensive.
14:15 So we have to take really good care of them.
14:18 So there's one at each of our telescopes that time-tags the data as it arrives at each site.
14:22 And then we record that data onto hard drives.
14:25 And then we ship those hard drives to a central computer in which all of the data from all the telescopes are combined and aligned together to synthesize a virtual telescope that finds the Earth.
14:36 So that's how we do it.
14:37 The telescope is not physically the size of the Earth, but we synthesize it using telescopes that span-
14:42 the size of the Earth.
14:43 Right.
14:44 So kind of like little different sensors at 10, 15 locations.
14:47 Yeah, exactly.
14:48 But you have to keep them in sync.
14:49 That's the big problem, right?
14:50 Yeah.
14:51 And timing is everything for what we do.
14:53 Yeah.
14:53 Yeah.
14:54 And you think about how off can you be.
14:56 And you're talking the speed of light.
14:57 A little, a microsecond, you cover a lot of distance in that time and the speed of light, right?
15:02 That's right.
15:02 Yeah.
15:02 We have to be extremely accurate because any shift in time between signals means that we're no longer in the reference frame of the black hole.
15:10 Everything that we see has to be in the reference frame of the black hole.
15:13 So it all has to be exactly aligned at the same time.
15:17 And there are many, many different aspects in the instrumentation of each telescope that needs to be measured very accurately and corrected at the time of combining the signals.
15:27 And then we also go through a very lengthy data processing step in which we correct all the additional effects.
15:32 We also have to deal with the earth atmosphere because we observe such a high frequency in the radio, which is 230 gigahertz, dealing with very high frequency radio waves.
15:41 And they're very affected by the atmosphere.
15:43 So water vapor and instability in the atmosphere can scramble and destroy our signal.
15:48 So we have to correct it after the fact and kind of model the atmosphere at each site, remove it.
15:54 And then we can average our data down and build signal that way, build signal to noise.
15:59 And then finally, at the end of that, all that processing is where imaging comes in.
16:03 And then we can combine the data with our imaging softwares and then reconstruct images that best fit the data.
16:10 Yeah, you had a really cool visualization showing how obviously the earth is curved.
16:14 I liked how you tried to reinforce that with folks.
16:18 I really hope now that the earth is round.
16:21 Otherwise, it would make our job very weird.
16:26 This portion of Talk Python To Me is brought to you by Cox Automotive.
16:30 Cox Automotive isn't a car company.
16:33 It's a technology company that's transforming the automotive industry.
16:37 The team at Cox Automotive understands the future of car buying and ownership.
16:41 And they're looking for software developers, data engineers, scrum masters, and other experts to help make that happen.
16:49 If you're interested in innovating with brands like Kelly Blue Book, Auto Traders, and others, then you should check out Cox Automotive.
16:56 Just visit talkpython.fm/cox to find out more.
17:01 Thank you to Cox Automotive for sponsoring the show.
17:06 Yeah, we definitely have to take into account the curvature of the earth because of this delay in curvature.
17:11 Two telescopes far enough apart have to deal with the earth's curvature because then the signal doesn't arrive at the same time at each place.
17:18 It arrives down here earlier than arrives here.
17:20 And so we have to take into account this curvature difference to make the signal be at the exact same time.
17:25 And we do that at the simple computer stage.
17:27 Yeah. So maybe let's follow the data for a minute because I think that that's pretty interesting.
17:32 So it starts by things hit the different telescopes.
17:36 How many did you say were involved at the time?
17:38 Yeah. Eight.
17:39 Eight telescopes at six different locations.
17:41 Yeah, you got these eight different telescopes and they're all at different points on the earth.
17:45 So the signal's hitting them at different times just because it's not a lot of time difference,
17:50 but it's enough to make a difference in the light waves or the radio waves.
17:54 But then the next step gets pretty interesting.
17:57 Because it's not like we're using our fiber, our gigabit connection to upload the data.
18:03 You record it to a huge block of hard drives and you physically send the hard drives, right?
18:09 Yes, that's right.
18:10 Yeah, they're basically just standard kind of helium drives that we use just stacked together,
18:15 the kinds that are in laptops.
18:17 And then we record our data onto these hard drives.
18:20 They're kind of split into random folders with some names that I can't decipher,
18:26 people who work at their computer supercomputers do.
18:29 And then we pack them up.
18:31 We drive them down each mountain and then ship them, usually via FedEx or UPS,
18:36 to our two central correlation facilities where we combine the data.
18:40 One is at MIT Haystack in Boston, right here.
18:43 And then one is in Bonn, Germany at the Max Planck Institute for Radiostromy.
18:48 So they get half the data and they get half the data.
18:51 Yeah.
18:51 And there's one guy who used to be a police officer who is now in charge of logistics of
18:57 the data.
18:58 That's right.
18:58 Right?
18:58 Yeah.
18:58 I always like telling the story of Don because Don Souza used to be a police officer for the
19:04 state of Massachusetts.
19:05 And then since then, for the last 20 years, he's been dealing with the shipments for MIT
19:10 Haystack Observatory.
19:11 And all of the data goes for him, including the ones that go to Bonn.
19:16 And he's been doing this for years.
19:18 And he is our main shipping guy for the EHT.
19:21 And he's never lost a single package.
19:24 That's incredible.
19:24 Yeah.
19:25 There was just one, I think, funny mishap that happened once where we had a package
19:29 incoming from the South Pole that was meant to be our South Pole equipment.
19:33 And then he opened it and it was just a bunch of fabric.
19:36 That was a little bit of an issue.
19:38 Silk?
19:39 Yeah.
19:39 I don't remember if it was silk, but I think it's just regular fabric.
19:42 But then luckily, the help of the shipping company, the mishap was found.
19:46 And then the fabric went to the rightful owner.
19:48 And then the equipment got returned to us.
19:50 So everything went well.
19:52 Yeah.
19:53 You're like, they didn't get what they expected and we definitely didn't.
19:57 That's right.
19:58 How bad would it have been if you had lost it?
20:00 Would it have been catastrophic or would it have been just...
20:02 So it wasn't data.
20:03 It was just a piece of equipment.
20:04 It would have been expensive to get another one and go through the test.
20:08 And they would have probably delayed a couple of things.
20:11 But other than that, it would not have been catastrophic.
20:13 Yeah.
20:14 The other thing I think is interesting, as you said, the color code, the hard drives with green
20:19 ready to record and empty and red being awful.
20:22 And they got to be processed.
20:23 Yeah.
20:23 We have little round stickers on our modules that have the hard drives that color code.
20:29 Yeah.
20:29 Yeah.
20:30 Yeah.
20:30 I mean, why not, right?
20:32 You want to look over and see like, oh, that pile, that pile is going out, not coming in.
20:36 Exactly.
20:37 Yeah.
20:37 And often at the sites, we have spare modules that we have just in case we have issues recording
20:43 onto certain ones.
20:44 So it's good to know which ones we've recorded on and which ones are spare.
20:48 Yeah.
20:48 So there's a lot of data here, which is why you ship the hard drives.
20:53 Yeah.
20:53 Yeah.
20:53 Yeah.
20:54 If you had a couple of gigabytes, nobody wants to ship hard drives, right?
20:57 That's, they can break, they can get lost.
21:00 It's relatively slow unless you have petabytes of data.
21:03 Yeah.
21:04 And then all of a sudden you realize this is actually a problem.
21:06 I've been just doing some backups of all the podcast episodes and stuff that I did.
21:11 And they're like 20 gigs per episode and there's hundreds of, you know, 700.
21:16 I've been uploading for days, for four or five days.
21:19 I'm only through one of the podcasts for part of the time.
21:22 I'm like, this is insane.
21:24 And I'm so excited to appreciate just like, how hard is it to send this much data?
21:28 So when you're talking petabytes, and these are remote locations as well for the satellites
21:33 often, right?
21:34 So maybe not the best connection.
21:36 Yeah.
21:36 And I think it would be pretty much unfeasible to send data from our site, especially the
21:42 South Pole is our most remote location.
21:44 And during the South Pole winter, the internet is not very good.
21:49 So we have to rely on some satellite connections that happen twice a day.
21:52 And so the connections are about fast enough that it would take about 40 years to get all
21:58 the data from the South Pole that we take during our campaign.
22:01 So it's really just not feasible.
22:03 Our founding director always says that you cannot beat the bandwidth of a 747 sold with
22:07 hard drives.
22:08 So shipping is always the best.
22:10 Yeah, that's incredible.
22:12 But apparently, apparently true.
22:14 Yeah.
22:15 Yeah.
22:15 So we have a picture, right?
22:17 We have this amazing picture of the black hole.
22:21 We'll talk about the story about how we get it, but maybe just describe it for people.
22:26 I'm sure everyone has seen it, but it's maybe been a couple of years.
22:29 Yeah.
22:29 So this is a picture of the M87 black hole, what we call the first image of a black hole.
22:34 We released this picture in April 2019.
22:37 So three years ago now.
22:39 And this picture comes from our 2017 observing campaign.
22:43 And it is of the central black hole inside the galaxy M87, which is 55 million light years
22:49 away from us.
22:50 So the light you're looking at in this picture is 55 million years old, which is pretty cool.
22:55 And when it left the black hole, the first mammals were starting to appear on planet Earth.
23:01 Wow.
23:01 That's amazing.
23:02 That's pretty cool.
23:03 Yeah.
23:04 So what we're seeing in the middle is this kind of dark patch, which we call the black hole shadow.
23:08 And there's this big ring of light around it.
23:10 And the dark patch is where the black hole is inside.
23:13 And the reason why it's dark is because inside there's the black hole event horizon, which is actually a little bit smaller than the shadow.
23:20 And the path of the light rays that are around the event horizon makes the darkness in which the light can no longer escape and makes it puff up.
23:29 And so the light rays kind of graze a bigger area, which is why the shadow is actually bigger than the event horizon.
23:35 And then this ring of light around it is very, very hot gas.
23:38 So we're talking billions of degrees, a hot gas swirling around in the black holes, either accretion disk or bottom of the famous jet.
23:46 And this gas is swirling around so much that it's glowing.
23:50 And it emits light in the radio, which are those radio waves that we observe.
23:54 And so this is light that hasn't crossed the event horizon.
23:58 It's not close enough to be purled in into the darkness and not being able to come out.
24:04 But it's just close enough to show us this shadow of the black hole.
24:07 It illuminates the darkness.
24:09 So there's all this mass that's been attracted, but it's like whipping around, kind of like a toilet bowl, right?
24:14 The water is not just shooting through the hole.
24:16 It's kind of spinning, but it's spinning near the speed of light.
24:19 And there's lots of friction and stuff, which makes it glow, right?
24:22 That's right.
24:23 Yeah.
24:23 And what about the jet?
24:24 Does the jet come from this accretion disk or does it somehow come out of the black hole or where does it come from?
24:30 I mean, it can't, right?
24:32 Yeah.
24:32 It doesn't come out of the black hole, but it does come pretty close to the black hole.
24:36 So this image in particular didn't teach us too much about the jet other than we can't see it in our image because at the time we didn't have enough telescopes to see the jet because it's very, very faint at the frequency we're looking at.
24:49 But our polarization image, which came out in 2021, which showed kind of a more spiral structure on top that trace magnetic field around the black hole, showed us that the magnetic fields around the black hole are kind of in a spiral shape that twist enough and are ordered enough to be able to launch the jet.
25:06 So they're coming from the rotation speed of the black hole that makes the kind of the space time twist and the magnetic fields twist.
25:14 And that is launching the jet.
25:15 Okay.
25:16 Amazing.
25:16 I was just thinking last night, getting ready for this and doing some of the research, you know, the black hole, the lights and light and all that stuff goes into it.
25:25 All this matter.
25:25 And it's completely dark.
25:27 But inside, it must have an insane amount of light and energy somehow in there, right?
25:32 Like if you could get into it, it must be really bright.
25:35 If none of the light ever created can ever leave, it must just be building up in there.
25:40 It's hard to tell.
25:41 It would be hard to explain what you would see inside.
25:44 Once you fall in, space time is getting stretched like crazy.
25:48 The more in you go, the more stretch it gets because it inevitably should end up in the singularity in which all of space and time is compressed into a single point.
25:57 So everything is kind of shifted and spaghettified.
26:00 And so even the light ahead of you, you wouldn't be able to see it because it can never travel back in the direction where you are.
26:07 So whenever you're falling, whatever's in front of you, you cannot see because it cannot go out.
26:12 It can only go in.
26:13 And so...
26:14 Yeah, maybe more like time stops and there's nothing.
26:16 Maybe it's not that bright, huh?
26:18 Yeah.
26:18 If you look back behind you at the horizon and at the outside, you would see the entire history of the universe.
26:25 Yeah.
26:25 It's kind of a...
26:27 It's a very mind-boggling place.
26:29 And I think people do get very creative about what could happen inside a black hole, what you would see.
26:34 There are a lot of thought experiments around it.
26:36 But obviously, because of the physical boundary that is the event horizon, we can never know what is beyond.
26:41 I often get this question in talks like, well, what you show us is just the shadow of the black hole.
26:46 It's not the actual black hole itself, which I think is not a true question because I don't think the statement is true because this is everything we can see of the black hole.
26:56 It is the black hole in the only way we can see it.
26:59 Whatever is inside, we can never see.
27:01 So this is always a picture of a black hole.
27:04 This is it.
27:04 This is absolutely it.
27:05 Yeah, this is as far as you can go.
27:06 You cannot go further.
27:08 Mellie in the audience says, whoa, that is weird.
27:10 I agree.
27:11 It definitely is weird.
27:13 I think we get a lot of very emotional reactions whenever we talk about kind of the whole aspect of looking at this image and what it represents, this end of space and time, this kind of point of no return and this whole kind of world of what is beyond it, what is outside of it.
27:30 Yeah, very strange.
27:31 All right. So back to following the data along, we've got petabytes of data collected to these hard drives on site at these six different locations.
27:41 They get shipped to the two places in Cambridge, in the U.S. and in Bonn, Germany.
27:46 And then what happens?
27:47 Yeah. And then once all of the disks arrive, they get plugged into the kind of readout machines that kind of read out all the data from all the different sites.
27:56 And then we have supercomputers that align the data using a bunch of it's a very complicated machine, but it takes into account the Earth's curvature, a model of the Earth, the positions of the telescopes, different instrumentation effects that we measure at the sites that get put into this big model.
28:12 So that we record at the telescope is kind of all of the signal the telescope receives, which includes signal from the black hole, but also the atmosphere, the surroundings, the air, the instrument and stuff.
28:33 But because the only thing the telescopes have in common is the black hole signal, the rest of the data doesn't what we call doesn't correlate.
28:41 So it is not seen in common.
28:43 So at that point, a lot of the data that's noise can we can get rid of because we only care about what the telescopes see in common, which is what comes from space.
28:52 And so then we can reduce the data from petabytes to like the kind of hundreds of gigabytes level, terabyte, gigabyte level.
29:02 And then at that point, after the correlation, the data are ready to move on to the data calibration stage.
29:08 So we end up with kind of data files per observing day of about maybe 100 gigabytes, 300 gigabytes, kind of manageable for software.
29:17 Right.
29:17 Yeah.
29:18 You could transfer it over the Internet sort of levels of data.
29:22 Kind of.
29:22 Yeah.
29:22 So usually we can put it on a common archive.
29:26 That's where we have it stored, the correlated data.
29:29 And then the data teams go in and get the data and then process them through their software.
29:34 And we use cloud computing facilities to do data processing as well.
29:38 It really speeds up things.
29:40 I bet.
29:40 These are like big supercomputers in those two locations, not like AWS or Azure, is it?
29:47 No, they're at the locations.
29:48 That's right.
29:49 Yeah.
29:49 Yeah.
29:49 They're basically computer clusters.
29:51 Are these shared computers?
29:53 Are they dedicated especially for this job or are they more general?
29:57 They're dedicated especially for dealing with radio interferometry data.
30:01 Necessarily, they're not used all the time by us.
30:04 They're also used a lot by geodesy experiments.
30:08 So geodesy is the science of studying tectonic plates on Earth.
30:12 So they basically do the exact opposite to us.
30:14 They use telescopes at different locations on Earth, looking at a common source that doesn't change.
30:19 And then that way they can track the movement of the locations of the telescopes on Earth.
30:24 And they do these observations many, many times.
30:26 And that's where they get all combined.
30:27 And in fact, through geodesy, that's how they get the model of the Earth that we use in our experiment to correct for this movement of the telescope.
30:36 So there's a kind of very nice cycle that happens at the same location.
30:40 Yeah.
30:41 Yeah, that is a sympathetic cycle.
30:43 That's great.
30:45 This portion of Talk Python To Me is brought to you by Sentry.
30:48 How would you like to remove a little stress from your life?
30:51 Do you worry that users may be encountering errors, slowdowns, or crashes with your app right now?
30:57 Would you even know it until they sent you that support email?
31:00 How much better would it be to have the error or performance details immediately sent to you,
31:05 including the call stack and values of local variables and the active user recorded in the report?
31:11 With Sentry, this is not only possible, it's simple.
31:14 In fact, we use Sentry on all the Talk Python web properties.
31:17 We've actually fixed a bug triggered by a user and had the upgrade ready to roll out as we got the support email.
31:24 That was a great email to write back.
31:26 Hey, we already saw your error and have already rolled out the fix.
31:29 Imagine their surprise.
31:31 Surprise and delight your users.
31:33 Create your Sentry account at talkpython.fm/sentry.
31:37 And if you sign up with the code talkpython, all one word, it's good for two free months of Sentry's business plan,
31:44 which will give you up to 20 times as many monthly events as well as other features.
31:49 Create better software, delight your users, and support the podcast.
31:53 Visit talkpython.fm/sentry and use the coupon code talkpython.
32:00 It's in this calibration stage where Python starts to make its appearance, right?
32:05 Yeah.
32:06 So we have our data processing softwares are, I think, mostly built in, let's see, Fortran and C code.
32:14 So more of the kind of heavier data crunching parts.
32:18 And then there are a number of kind of post-processing tasks that do use Python.
32:23 Especially we have a kind of suite of post-processing tasks that make use of pandas a lot.
32:29 Because it offers a very neat data structure that allows us to organize data correction across, you know, kind of different columns of types of data.
32:37 And that's been very helpful for us.
32:39 Yeah.
32:40 You also get a lot of the matrix multiplication, vector math type of features from there, right?
32:43 Yeah.
32:44 Yeah.
32:44 It's very helpful.
32:45 And it has made our data processing a lot cleaner to do it through that data structure.
32:52 Now, this cycle where you take the data, you factor out the atmosphere and other interference, and then you add in all the good parts of the signal, the positive parts of the signal from the different telescopes.
33:05 You analyze it.
33:07 You said that this cycle goes around a couple of times and takes like a year and a half or something, right?
33:12 Yeah.
33:13 So from the time we took the data, which was in April 2017, to the time we released this image in April 2019, about one and a half years of that time was spent on the data processing.
33:25 And the feedback loop between our correlation centers and the data processing team.
33:30 I was part of the data processing team.
33:32 We're quite a small team working kind of around the clock on a pretty fast turnaround, just because we had kind of a lot of data issues identified at each site that needed to be run down and then going back upstream and then back down.
33:45 And we also had a feedback cycle with the imaging team that looked at early versions of the data and then discovered issues and then again going back upstream.
33:54 So there was a long process of really trying to fix all of the instrumentation parts that would contaminate the black hole data.
34:01 And then eventually we finally had a data set mature enough that would allow for actual imaging.
34:07 And then once that was done, we were dealing with data files in the kind of 100 megabyte sizes.
34:12 After data processing, we could really average our data down.
34:15 So we're dealing with complex numbers.
34:17 The data we get from the black hole are complex visibilities.
34:21 They have an amplitude and a phase.
34:23 Like 7 plus 2i, complex in that sense?
34:26 Exactly.
34:26 Yes.
34:27 Yeah.
34:27 And so because we have complex numbers, if we try to average numbers in which the phase part don't align, we end up destroying our signal because of destructive interference.
34:37 So we needed to align the phases in order to average down our signal to have constructive interference and build up signal.
34:44 And that's really the key part of the data processing.
34:47 That's what we do in order for the imaging teams to have the best data possible.
34:51 And then in the kind of 100 megabytes data, then we move on to our imaging software.
34:56 Indeed.
34:57 Quick question from the audience.
34:59 What sort of wait times do you experience when you're iterating this step when you're sort of working in, say, a Jupyter Notebook and you press run?
35:07 How long until you see the results?
35:09 I guess.
35:09 What's the experience of working like this?
35:11 Is it a lot of batch processing and you walk away for lunch?
35:14 Or is it small enough that you're getting immediate responses?
35:19 Yeah.
35:19 So I think outside of the Python packages is where we run most of the big data crunching.
35:24 I think in those parts, it would take a couple of days to run through our calibration pipeline.
35:29 And the Python parts would take maybe a couple hours.
35:33 Then when we're running diagnostic Jupyter Notebooks, it would take maybe not long because then at that point, we're basically in the 100 megabyte parts just doing data checks in which we make use a lot of Jupyter Notebooks, in fact.
35:46 And math plot will have to plot through our entire data steps and cross-check every part.
35:52 We have all these diagnostic notebooks that look at our data.
35:55 And those don't take much time to generate.
35:58 I would say maybe 20 minutes would generate kind of a single switch from a Jupyter Notebook.
36:03 Sure.
36:03 Very interesting.
36:04 So most of the work is done by this supercomputer and seeing Fortran.
36:09 And then you kind of are working with the raw answers in just numerical form, but you want them visualated.
36:15 You want them correlated or things like that.
36:17 Yeah.
36:17 And then when we're really looking to diagnose our data to find instrumentation errors, then visual representations are extremely useful.
36:25 And we've made a lot of use of kind of Jupyter Notebooks, especially in our data processing checks, to make sure everything looks good at each step of the pipeline.
36:35 All right.
36:35 One more audience question, then I'll move on.
36:37 Mellie asks, do you do logging or any staging to keep track of the stages they're at and not in a loop?
36:45 Yeah.
36:45 So each data pipeline has multiple stages in which we have kind of checkpoints at each stage where we have a suite of kind of Jupyter Notebooks or our suite of plots generated so that we can go back.
36:57 If there's an issue, we can go back in each stage and look at the outputs and make sure that we can generate or we can identify where the issue has happened or when the failure has occurred.
37:07 We have logs also of every process that comes in.
37:11 We also do very strict version control of each kind of software version.
37:15 Every time we run something, we do have a kind of version control package of all the software within one single pipeline run that we keep track of as well.
37:25 That's really interesting because you want to have reproducibility, right?
37:29 Absolutely.
37:30 Maybe something minor changed about the way Pandas does floating point operations.
37:35 I'm just making this up.
37:36 But, you know, theoretically over versions and give you a slightly different answer, right?
37:40 So you want to have a really clear snapshot of the entire system, right?
37:44 That's right.
37:45 And this was also very important for us when we released the papers for this image.
37:50 We also released the version controlled pipelines, both on the data side and on the imaging side that contained, you know, the exact version and kind of container form of the software that we use and the scripts that we used to generate these exact results.
38:06 Oh, awesome.
38:06 So this won the Nobel Prize, right?
38:08 It did not.
38:09 It did not?
38:11 No.
38:11 I'm sorry.
38:12 I don't know why I thought I did.
38:13 No, we won the breakthrough prize in physics in 2019.
38:17 It won the heart and the minds though.
38:19 So you did point out in your talk about how much this made a splash among people who are not scientists.
38:26 Yeah, that was something that was very shocking for us because when we building up the project, obviously we had talked about the projects in various media forums and it was interesting in the astronomy community.
38:37 So we knew there was some traction about the project that people would be interested in the results.
38:42 But we did not expect the magnitude at which this image would really go into pop culture.
38:48 Especially the fact that the next day after this release, it was on front pages of newspapers around the world.
38:54 Just really unusual for science results, especially around times around these times when 19 was not, you know, the most happy of years.
39:03 There was plenty of other stuff to occupy the news.
39:05 So it's definitely unusual.
39:07 And, you know, it ended up kind of trending number one on Twitter, which is, again, really surprising for science news.
39:14 We did not have a trending campaign, really.
39:16 We didn't prepare a hashtag.
39:17 It was not something we were not really social media savvy kind of people.
39:21 So it was it was not planned.
39:23 It just kind of organically happened.
39:25 And then there were so many memes and references.
39:27 And we were kind of referenced on talk shows and documentaries and news segments.
39:33 So it was really beyond anything we had expected.
39:36 And there was a lot of demand also to hear from us, not just from astronomy or physics, you know, academics,
39:42 but also a lot of demand from planetariums and science camps and even museums.
39:48 We did a bunch of talks at museums, which was really enjoyable and kind of reached to a different audience.
39:53 And that was all really cool.
39:55 I think really nice experience to kind of reach out to the community and make sure that people are part of it,
40:00 because these science results happen in very big teams.
40:03 And not just that, our teams are funded by taxpayer dollars.
40:07 They build on resources from various communities, including, you know, the developer community in programming and instrumentation community.
40:14 And, you know, all the giants and physics that came before us.
40:18 So it's really not just kind of a personal victory as a member of our team.
40:22 It's kind of a global effort.
40:24 And we want to make sure that we send a signal that teamwork is really a global thing and that big science happens in big teams.
40:30 And not everybody's playing a part in this in some way.
40:34 Are you familiar with the Mars rover GitHub?
40:37 Not the rover itself, but the Mars, the badge, I guess it's called.
40:41 No, I don't think so.
40:43 People got this for the people who worked on.
40:45 Where is this?
40:46 Oh, somebody show me the badge.
40:49 So for people who worked on the Mars lander, they got a special badge.
40:55 I don't know where it is.
40:56 Oh, really?
40:56 Oh.
40:57 I feel like there should be one of these as well.
40:59 That would be cool.
41:00 Right?
41:01 For the people that worked on this project.
41:02 Yeah.
41:03 There should be like a little black hole badge.
41:05 So I don't have it.
41:06 That would be very cool.
41:07 But, you know, it's like a little badge, like here's the Arctic contributor one.
41:10 There's a Mars rover one.
41:11 So people in GitHub out there, let's make a black hole badge.
41:15 Because there's so many of these open source projects that are indirectly used and contributors
41:20 to it.
41:20 And they could have a black hole badge.
41:22 And that would be awesome, I think.
41:22 That's a great idea.
41:23 I would be happy to reach out to people and try to see if I can make that happen.
41:27 I think that would be really awesome.
41:29 Yeah.
41:29 Yeah.
41:30 Indeed.
41:30 I don't know.
41:31 I think I don't know the username enough people to search for it.
41:34 But anyway, I think that would be really cool.
41:35 I think there should be a badge.
41:36 But let's go and talk Matplotlib for a minute.
41:39 So here you are presenting this keynote.
41:42 Yeah, my favorite.
41:44 Yeah, yeah.
41:45 Tell us about this picture that you got here.
41:46 And then we can maybe dive into how you know the picture that we see is actually the picture.
41:52 Yeah.
41:53 This is my physics process, which is kind of underwhelming when you show it to most people.
41:57 But people who are radio astronomers like me would be extremely excited seeing this.
42:02 And this is really the first kind of depiction of M87 I saw after we finished the data processing
42:08 pipeline.
42:08 This is before anyone made any image, by the way.
42:11 It was in May 2018 when we actually finished the very first run of the full pipeline in
42:17 data calibration.
42:18 And this was the end point, this plot.
42:20 And what this plot shows is kind of on the y-axis, there's a flux density, which is basically
42:26 the brightness of signal seen by pairs of telescopes.
42:29 And then on the x-axis, there is baseline length, which tells us kind of the separation between
42:34 pairs of telescopes.
42:35 So telescopes close together see a lot of signal in common.
42:38 Telescopes far apart see kind of smaller signal in common.
42:42 And depending on their location, they probe different sections of the image.
42:46 And so what we see here is this kind of, how would I say that, this kind of bump, double
42:50 bump in the image.
42:52 And what this double bump actually tells us in the plot is if you look at the dashed line,
42:57 this is what we would expect if the image on the sky was a uniform ring.
43:02 Uniform as in the brightness along the ring is the same everywhere.
43:06 So it's just a closed ring and the brightness is the same everywhere.
43:08 And so it turned out that this bump structure looked really close to a uniform ring.
43:14 And this is already really exciting because we were already trying to imagine what does
43:19 the ring look like and how this plot also tells us how big it is.
43:23 It tells us it was actually 42 microseconds wide, this ring, without any image.
43:28 And what was also really cool is that if you look at the first dip location, you will see
43:33 that the data actually split into two levels.
43:35 There is a lower level and an upper level.
43:37 And these correspond to two different directions on the sky that the stations are looking at.
43:42 The lower level are looking at the source in the east-west direction, so across, and they're
43:48 seeing a kind of dip.
43:50 And the other ones are looking at it in the north-south and they're seeing more signal.
43:55 And what this difference tells us is that the ring is not uniform, but it's actually asymmetrical
44:02 in the north-south.
44:03 There's one part that is brighter, either north or south, that is brighter than the other
44:07 side.
44:07 And if you look at our final image, it is brighter on the bottom than it is at the top.
44:12 Whereas if you were to slice across, you will see it's the same, right?
44:15 If you were to slice across, it's the same.
44:17 But if you were to slice like this, you have less signal up here and more signal down here.
44:21 Already the plot told us so much about what we're looking at.
44:25 Yeah.
44:25 So before we hit a picture, you're like, oh, we think we're onto something here, right?
44:29 Yes.
44:30 It was super exciting.
44:31 But then we were very careful because we thought, okay, there's a lot we can talk from this plot,
44:36 but let's not try to get ahead of ourselves.
44:39 Because there are a lot of types of images that could be tweaked to mimic this kind of structure.
44:45 And so that was kind of part of the next stages in which we wanted to split our teams into our big
44:52 imaging team into four independent teams.
44:54 And each team works independently for about seven weeks on analyzing the data in any means they wanted,
45:00 with any software they wanted, any decision they wanted.
45:03 And we came together after seven weeks at a workshop to compare the images.
45:07 And each team submitted a single image.
45:09 And it turns out that the images between the four teams were very, very similar to each other.
45:14 And so that was really exciting.
45:16 And everybody got a ring of the same size, 42 micrach seconds and brighter on the bottom.
45:20 Even though there were kind of some small differences across the images that came from the user-based
45:25 choices in the software, the main structure was there for everyone.
45:30 And I think that was one of my favorite days in the collaboration because we had so much fun that day.
45:35 It was such a big relief because we were using so many different techniques,
45:39 kind of imaging software that we weren't sure we would all get the same answer.
45:44 So we were really relieved that we did.
45:46 And then, you know, at the end of the day, we all went drinking at a bar and turned out it was karaoke night.
45:51 So we all sang karaoke together.
45:53 It was such a lovely day.
45:55 Were there any space-themed songs like Hello Major Tom or any of these things?
46:01 We sang Gua Tum San.
46:03 Oh, there you go.
46:03 Yeah.
46:04 That was a must.
46:07 Perfect.
46:07 Yeah.
46:08 But we changed the lyrics to Blackpool Shadow.
46:10 If you're taking petabytes of data and running them through a bunch of algorithms until they come down to megabytes,
46:16 or you said the final picture is actually like less than one meg.
46:19 Yeah.
46:20 Then, you know, what you're seeing, is that actually what you're seeing?
46:23 Or is that artifacts built up along the way, right?
46:26 So this must have been really comforting to try these different algorithms and go, they all come up with the same picture.
46:30 Yeah.
46:30 I think we were confident about what the data were telling us, but we wanted to make sure that we understood how our software were responding to the data.
46:37 So, you know, from kind of objective perspective, when we looked at the data plots, we knew what it was telling us.
46:44 But we wanted to make sure that we looked through every avenue of possible ways of creating images that look similar to the data.
46:50 And in fact, it's really very hard to create images that don't look like what we have.
46:57 And so no matter how much we tweaked our software, we would always end up with something very similar to the final image.
47:04 But we still wanted to put our software through this test and do a kind of process in which we would test it.
47:10 And in the end, the final stage ended up being trying to find what is the best kind of combinations of our software choices that gave us the best image.
47:19 Because we generated so many images with user-based choices, and they ended up pretty similar to each other with the base structure.
47:26 But how do you pick one image?
47:27 So that was kind of the dilemma we had at the final.
47:31 We didn't know how to pick a single image.
47:33 So we decided to create these kind of fake data sets that mimicked our data in which we knew the real truth images.
47:40 And they looked like rings or disks or double sources.
47:43 And then we made our softwares go through thousands of combinations of these parameters and kind of tested how well they could reproduce all four of them, all four images.
47:54 And then the ones that were kind of, we ranked them.
47:57 And then number one was the best image for each software.
48:00 And then the final image, you know, the famous image of a black hole is actually just the average of the three software images, the three best images from the software.
48:08 And this is also only one image of the black hole.
48:11 This is only April 11.
48:13 We observed M87 for four days in 2017.
48:17 So we have four images of this black hole from 2017.
48:20 And they all look the same.
48:22 And they all went through separate day observing, kind of separate processing, and always giving the same answer.
48:28 So you all are pretty sure that this is the picture.
48:30 Absolutely.
48:31 At least this is the radio astronomy picture.
48:33 Yeah, this is the picture at 230 gigahertz.
48:36 Yeah, exactly.
48:37 There's also pictures of that general space with Hubble and some other things that you laid out.
48:44 Yes, this is a really fun part of our campaign also, because obviously we're trying, the purpose of our experiment is to learn about black holes.
48:52 We want, I mean, these objects are super fascinating.
48:55 They're kind of mind boggling in how they exist and what they do to galactic environments.
49:00 These jets are enormous and they're pierced through entire galaxies.
49:03 And yet they come from a very tiny part of the galaxy itself.
49:07 And so in really understanding black holes, it's obviously really useful to look at one up close.
49:12 But we need to combine that knowledge with how it looks across all colors, all wavelengths.
49:17 And so we had a big multi-wavelength campaign at the same time as these observations across lots of different instruments.
49:25 So we had instruments in the high energy, in the X-ray, infrared, in optical, and also other radio wavelengths.
49:32 So we had a lot of partnerships with other observatories too, to make that happen.
49:37 And we learned a great deal about the black hole and its jet through that process.
49:41 Yeah.
49:41 It seems that black holes, supermassive black holes are a fundamental part of galaxies almost, right?
49:47 Absolutely.
49:47 They live in the centers of most galaxies.
49:50 M87 is one of the special ones because it has this big jet coming out of it.
49:55 So it's very nice to get a look at one that has a jet up close.
49:58 And actually, our Milky Way black hole, Sagittarius A star, is one of the very common, boring ones.
50:04 And so the fact that we can have both of them and look at both of them is kind of special because it gives us kind of two very different classes of black holes.
50:13 That end up looking very much the same.
50:15 Sagittarius A star's image looks a lot like M87.
50:18 This is really just because even though they're totally different black holes, they differ in mass by a factor of about 1500.
50:24 And our Milky Way is a spiral galaxy, right?
50:27 But M87's galaxy is elliptical and it's much older and much bigger than our Milky Way.
50:32 And M87 has a jet and Sagittarius A star doesn't seem to have one.
50:36 So there are two very different black holes.
50:38 And yet, once you get up close, it's really just the effects of gravity is so strong that it's really all you see.
50:44 And it's so cool that they look the same.
50:47 Yeah, it is amazing.
50:47 I guess it's worth just pointing out just how large the M87 black hole is.
50:53 Oh, yes.
50:54 The shadow of the M87 black hole could fit our entire solar system very easily.
50:59 It could, you know, the orbit of Pluto would be about in the middle, in the kind of mid-range inside the shadow.
51:05 And Voyager 1, which is the furthest human-made object, would be just at the edge of the shadow right now.
51:11 Yeah, that's incredible.
51:12 Very, very big.
51:13 If it were there, it would get sucked back in.
51:15 But if it were unaffected, it would be at the edge.
51:19 Yeah, so also 6.5 billion solar masses.
51:22 That's right.
51:23 Yeah.
51:24 That's really large.
51:25 That's a lot of mass.
51:26 It's actually one of the heaviest black holes in our universe.
51:29 I think the current heaviest is about 10, I think 10 billion solar masses, maybe a little more.
51:37 Wow, so that's not that much larger, yeah.
51:38 Yeah, it was one of the pretty larger ones.
51:41 Yeah.
51:41 All right, well, we're getting a little short on time.
51:44 So let me close this out with a bit of a future-looking question, and I'll give it to the IkuVu from the audience.
51:51 So what's next for EHT?
51:54 I'll ask it that way.
51:55 Yeah.
51:55 What now?
51:56 Since our 2017 campaign, we've kept observing.
51:59 We observed in 2018, where we added one telescope and increased our bandwidths, where we can have more sensitivity and cooler observations of magnetic fields.
52:08 We also observed in 2021, which was a kind of mid-COVID observation, which was a very strange one.
52:14 And in 2022, we added two new stations after that.
52:18 So we're now up to 11 with the EHT.
52:21 And we're trying to expand our array to have more telescopes.
52:24 So there's currently an effort called the Next Generation Event Horizon Telescope.
52:29 So the EHT so far only borrowed telescopes that just happened to be at the right locations that were actually built for completely different science programs, just radio telescopes that were able to observe at the frequency we wanted and at the right place.
52:43 So we didn't have much of a control over the locations of the telescopes.
52:47 And so in order to see more of our image, for example, to see the jet in MA-7, we need a lot more telescopes.
52:53 So the Next Generation EHT plans to have more control over where telescopes are going to be put.
52:57 So we're planning to get smaller dishes because we have the sensitivity now with the current EHT.
53:03 Smaller dishes at the locations where we need them, where we have holes in our virtual mirror to recover the structure.
53:11 And eventually, we'd like to observe more often.
53:13 So now we only observe two weeks a year.
53:15 We want to be able to observe every two weeks or every month.
53:19 And eventually, we could make movies of M-87.
53:21 And also, if we have enough telescopes, we would be able to make movies of Sagittarius A-Star as well.
53:26 And that will really show us the connection between the black holes, the gas swirling around it, and its jet and magnetic fields.
53:32 I think we could learn so much about black holes through that.
53:35 It would be so exciting.
53:36 You could get precise speed of the accretion disk and how it evolves.
53:40 Yeah.
53:41 And that's about a 10-year time scale.
53:44 In the far future, in kind of 20 to 30 years, members of our team are currently actively thinking about putting satellites into space.
53:51 Since we're running out of Earth's diameter to make a bigger telescope, there's only two ways to make your telescope bigger.
53:57 Either make the separation bigger or go to higher frequency so we have higher resolution.
54:03 And because of the Earth's atmosphere and the size of the Earth, we're limited in both.
54:07 But by going into space, we'd go above the atmosphere so you can go to higher frequency and you could have larger distances.
54:14 So by putting satellites into space, we could have enough resolution to maybe see up to 10 or even 50 more shadows of black holes, which would be really cool.
54:23 And then we'd have amazing sharp images of the two that we know and love to really test theories of gravity, which would be terribly exciting.
54:31 But of course, the technology to do that is not there yet, but it is moving forward.
54:35 And it's something we're thinking actively about.
54:38 Getting there.
54:38 Another thing you pointed out was all the results you got from this so far still back up the general theory of relativity, right?
54:44 That's right.
54:45 Yeah.
54:46 Einstein seems to be still correct.
54:48 Our black hole shadows are still very circular, which is what Einstein's theory predicts.
54:52 But we need much sharper images to see bigger differences.
54:55 We were able to rule out some theories, but there are still some theories that survive.
54:58 So we need to get to sharper and sharper images and a stronger and stronger test.
55:03 But I think we're moving in that direction.
55:04 Our first image has really just opened this new laboratory of images of black holes.
55:09 So it's going to be an exciting new field.
55:12 Yeah, this is possible.
55:13 Now let's build on it, right?
55:16 Yeah, absolutely.
55:17 Awesome.
55:17 All right.
55:18 Well, I think we'll leave it there for the black holes, but congratulations to you.
55:22 And I know that all the other people, often you point out that you're just the representative for this great big team.
55:28 Yeah.
55:28 I only play a small part.
55:30 It's really a big team effort and a community effort, and everybody is part of it.
55:34 Yeah, indeed.
55:35 Now, before we get out of here, let me ask you the final two questions.
55:38 I always ask, if you're going to write some Python code, what editor do you use these days?
55:42 What editor?
55:43 Oh, my God.
55:44 Super boring.
55:45 I use de-edit.
55:46 Oh, perfect.
55:46 Awesome.
55:47 Yeah, very boring.
55:48 If there's any Python package library you want to give a shout out to, maybe that was central to this work.
55:53 I know you already mentioned pandas and matplotlib.
55:56 Anything else that was really useful here?
55:58 Yeah, there was a really cool nested sampling algorithm that was developed by a Harvard grad student called Dynasty that was super useful for her modeling work and really kicked off a lot of that analysis.
56:08 So I'd like to shout that out, too.
56:09 And it's open source.
56:10 Yeah.
56:11 I'll put a link to it in the show notes for people.
56:13 All right.
56:13 Well, Sarah, thank you so much for coming on the show, for sharing your work.
56:17 As you saw, it's been an inspiration to everyone around the world.
56:20 So thank you.
56:21 Yeah, thank you for having me.
56:22 Yeah, you bet.
56:23 Bye.
56:25 This has been another episode of Talk Python To Me.
56:27 Thank you to our sponsors.
56:29 Be sure to check out what they're offering.
56:31 It really helps support the show.
56:32 Join Cox Automotive and use your technical skills to transform the way the world buys, sells, and owns cars.
56:40 Find an exciting position that's right for you at talkpython.fm/cox.
56:45 Take some stress out of your life.
56:47 Get notified immediately about errors and performance issues in your web or mobile applications with Sentry.
56:53 Just visit talkpython.fm/sentry and get started for free.
56:58 And be sure to use the promo code talkpython, all one word.
57:01 Want to level up your Python?
57:03 We have one of the largest catalogs of Python video courses over at Talk Python.
57:07 Our content ranges from true beginners to deeply advanced topics like memory and async.
57:13 And best of all, there's not a subscription in sight.
57:15 Check it out for yourself at training.talkpython.fm.
57:18 Be sure to subscribe to the show, open your favorite podcast app, and search for Python.
57:23 We should be right at the top.
57:24 You can also find the iTunes feed at /itunes, the Google Play feed at /play,
57:29 and the direct RSS feed at /rss on talkpython.fm.
57:34 We're live streaming most of our recordings these days.
57:37 If you want to be part of the show and have your comments featured on the air,
57:40 be sure to subscribe to our YouTube channel at talkpython.fm/youtube.
57:45 This is your host, Michael Kennedy.
57:47 Thanks so much for listening.
57:48 I really appreciate it.
57:49 Now get out there and write some Python code.
57:51 Thank you.
57:52 Bye.
57:53 Bye.
57:54 Bye.
57:55 Bye.
57:56 Bye.
57:57 Bye.
57:58 Bye.
57:59 Bye.
58:00 Bye.
58:01 Bye.
58:02 Bye.
58:03 Bye.
58:04 Bye.
58:05 Bye.
58:06 Bye.
58:07 Bye.
58:08 you you Thank you.