OSMnx: Python and OpenStreetMap


Episode Deep Dive
Guest Introduction and Background
Dr. Geoff Boeing is an assistant professor at the University of Southern California (USC). His work intersects urban planning, data science, and spatial analysis, and he is the creator of OSMnx, a Python library that simplifies accessing and analyzing OpenStreetMap data. Throughout his academic career, Geoff has explored how street networks shape our daily experiences, focusing on transportation, walkability, and resilience in cities.
What to Know If You're New to Python
If you're just getting started with Python and want to follow along:
- Familiarize yourself with fundamental libraries for data analysis such as
pandasandgeopandas. - Learn basic plotting and visualization skills (e.g., with
matplotlib) to see your data in action. - You'll benefit from a broad overview of how packages are structured and installed in Python (e.g.,
piporconda).
Key Points and Takeaways
- OSMnx: The Core of the Episode
OSMnx is a Python package that streamlines downloading and analyzing OpenStreetMap street data. Geoff built it to solve his own research hurdles, but it has grown into a widely used library for geospatial modeling, routing, and visualization. It automates queries to the Overpass API, converting raw map data into graph models or GeoDataFrames for analysis.
- Links and Tools:
- How OpenStreetMap Provides the Foundation
OpenStreetMap (OSM) is described as "Google Maps meets Wikipedia", anyone can edit and improve it, and the data is openly licensed. This democratizes mapping and allows people to build new apps or conduct research on a global scale. Geoff emphasized how crucial it is that the data be free to download and use, even though it can contain biases based on who contributes.
- Links and Tools:
- Why City Street Orientation Matters
From Barcelona's diagonal grid to Boston's winding streets, OSMnx can quickly generate "polar histograms" showing how roads are oriented. These visualizations help illustrate how historical, cultural, and topographical factors shape urban layouts. Grid-based cities like Chicago have streets lining up north-south or east-west, while older cities can have many twisting directions.
- Links and Tools:
- Urban Planning Insights and LA as a Case Study Los Angeles is both an ideal and ironic place to study urban planning, given its sprawl and reliance on cars. Geoff highlighted that cities grow around their transportation technologies. When a city is built for cars, it can be tough to retrofit walkability or public transit. OSMnx helps researchers quantify these features and identify how to make improvements.
- Overpass API Under the Hood
The Overpass API is the gateway to OpenStreetMap data, but its query language (OverpassQL) can be challenging. OSMnx simplifies this by handling queries automatically. It also caches the results locally to save time on repeat analyses and reduce load on public Overpass servers.
- Links and Tools:
- Handling Big Data and Performance
For large-scale urban or global analyses, queries can involve millions of road segments. OSMnx integrates with libraries like GeoPandas, NetworkX, and
r-treeto speed up spatial operations. Geoff discussed using GPUs or academic high-performance computing clusters for massive computations, especially for pathfinding or betweenness centrality in huge graphs. - Collaboration in Open-Source and Academia
Despite OSMnx's popularity (thousands of GitHub stars), finding direct funding for open-source research tools is tough. Geoff mentioned the "side-hustle" nature of maintaining OSMnx and how academic grants typically focus on applied projects. Even so, the library thrives on community contributions.
- Links and Tools:
- Graph Theory and Routing By representing streets as nodes and edges, researchers and developers can quickly calculate shortest paths, identify high-traffic routes, or measure walkability. OSMnx includes a simple routing engine, but it also plays nicely with specialized libraries for more advanced algorithms or GPU-accelerated analytics.
- Resilience and Disaster Planning The shape and connectivity of a street network can determine how well a city bounces back from natural disasters. Redundant grids are more resilient than sparse, branching networks. By modeling infrastructure with OSMnx, planners can run scenarios, propose retrofits, or spot weak links.
- Open Data, Open Science, and Community Engagement OSMnx aligns with open science by lowering the barrier to entry for spatial analytics. Citizens can fix local map data in real-time, while researchers can replicate and expand each other's analyses. This synergy of open data and open-source tools fosters innovation in geography, data science, and beyond.
Interesting Quotes and Stories
- "It's weird. This is very much my side hustle, but it's also been a labor of love for a long time." , Geoff reflecting on balancing academic duties with open-source development.
- "If you don't like writing the algorithm, I'm not sure why you're in software development in the first place." , A candid take on the role of large language models and coding.
- "LA is an ironic place to be an urban planning professor because it can be so frustrating for a lot of best practices." , Geoff on the unique challenges of studying and living in Los Angeles.
Key Definitions and Terms
- OpenStreetMap (OSM): A collaborative, open-source map of the world that anyone can edit and use.
- Overpass API: A web API for querying OSM data. OSMnx automates OverpassQL queries for simpler data retrieval.
- OSMnx: A Python library created by Geoff Boeing to simplify downloading, analyzing, and visualizing OpenStreetMap data.
- GeoPandas: An extension of Pandas that supports geospatial data.
- NetworkX: A Python library for graph analysis and algorithms.
- Street Network Model: A representation of a city's roads and intersections as a graph (nodes for intersections, edges for road segments).
- Polar Histogram: A circular histogram visualizing orientations of streets around the compass.
Learning Resources
Here are a few courses that may help deepen your Python data and web skills.
- Data Science Jumpstart with 10 Projects: A quick way to build several data-centric Python projects.
- Python Data Visualization: Learn to create insightful plots to support geospatial and other analyses.
- Move from Excel to Python with Pandas: Helpful if you're transitioning from spreadsheet workflows to Python-based data processing.
Overall Takeaway
OSMnx shows just how powerful Python can be in the geospatial realm. Thanks to open data and open-source collaboration, even a single developer's side project can fuel worldwide research, urban planning decisions, and countless hobby projects. If you're curious about mapping, data science, or simply want to see the real-world impact of Python tools, this conversation with Geoff Boeing offers a compelling glimpse into how code and community can come together to reshape our understanding of cities.
Links from the show
OSMnx Documentation: readthedocs.io
OSMnx GitHub: github.com
OpenStreetMap: openstreetmap.org
Open Database License: opendatacommons.org
ID Editor (Web Editor): wiki.openstreetmap.org
Planet OSM: planet.openstreetmap.org
Overpass API: wiki.openstreetmap.org
GeoPandas: geopandas.org
NetworkX: networkx.org
Shapely: shapely.readthedocs.io
Watch this episode on YouTube: youtube.com
Episode #495 deep-dive: talkpython.fm/495
Episode transcripts: talkpython.fm
---== Don't be a stranger ==---
YouTube: youtube.com/@talkpython
Bluesky: @talkpython.fm
Mastodon: @talkpython@fosstodon.org
X.com: @talkpython
Michael on Bluesky: @mkennedy.codes
Michael on Mastodon: @mkennedy@fosstodon.org
Michael on X.com: @mkennedy
Episode Transcript
Collapse transcript
00:00 On this episode, I'm joined by Dr. Jeff Boeing, an assistant professor at the University of Southern California,
00:05 whose research spans urban planning, spatial analysis, and data science.
00:09 We explore why OpenStreetMap is such a powerful source of global map data,
00:14 and how Jeff's Python library, OSMNX, makes that data easier to download, model, and visualize with Python.
00:21 Along the way, we talk about what shapes city streets around the world, how urban design influences everything from daily commutes to disaster resilience,
00:30 and why turning open data into accessible tools can open up completely new ways of understanding
00:36 our cities. If you've ever wondered how to build or analyze your own digital maps in Python,
00:42 you won't want to miss this conversation. This is Talk Python To Me, episode 495,
00:47 recorded Thursday, January 16th, 2025.
00:51 Welcome to Talk Python To Me, a weekly podcast on Python. This is your host, Michael Kennedy.
01:09 Follow me on Mastodon, where I'm @mkennedy, and follow the podcast using @talkpython,
01:15 both accounts over at fosstodon.org. And keep up with the show and listen to over nine years
01:20 of episodes at talkpython.fm. If you want to be part of our live episodes, you can find
01:26 the live streams over on YouTube, subscribe to our YouTube channel over at talkpython.fm/youtube
01:31 and get notified about upcoming shows. This episode is sponsored by Posit Connect from
01:37 the makers of shiny, publish, share and deploy all of your data projects that you're creating
01:41 using Python streamlet dash shiny bokeh FastAPI flask quarto reports, dashboards and API's
01:50 Posit Connect supports all of them.
01:52 Try Posit Connect for free by going to talkpython.fm/posit, P-O-S-I-T.
01:58 And it's also brought to you by us over at Talk Python Training.
02:02 Did you know that we have over 250 hours of Python courses?
02:07 Yeah, that's right.
02:07 Check them out at talkpython.fm/courses.
02:11 Jeff, welcome to Talk Python To Me.
02:13 - Thank you for having me.
02:14 - It's great to have you here.
02:16 We're gonna talk maps and consuming map data a lot of interesting research that you've done with that data.
02:23 So you have a very cool project, OSMNX, Open Street Map Network X, that we're going to dive into.
02:31 And it really makes all of this street and map data super accessible to users of Python, right?
02:37 - Yeah. - Yeah.
02:39 Excellent. I'm really looking forward to talking about that.
02:40 Before we dive into it though, just a quick introduction.
02:44 Who are you?
02:44 - My name is Jeff Boeing.
02:45 I'm an assistant professor at the University of Southern California in Los Angeles. I'm in its Department of Urban Planning and Spatial Analysis. And
02:55 most of my research and teaching are around that intersection of urban planning and spatial analysis. I did my PhD in city planning at UC Berkeley and
03:05 my focus is on urban data science. So using Python tools, usually open data, to
03:11 try to understand cities and housing markets and transportation networks and
03:16 how people move through space, how we can make our cities more resilient
03:21 to natural disasters, which is relevant in LA this week.
03:24 Also more equitable, nicer places to walk around, and basically just better for urban living.
03:31 - Okay, well, that sounds like amazing, amazing research.
03:35 It's probably interesting to live in LA as one of the bigger, crazier locations
03:40 in terms of traffic and congestion and population.
03:43 It's not New York in terms of density, but it's probably its own special beast, I imagine.
03:48 - Yeah, it is.
03:49 LA is an ironic place to be an urban planning professor because it can be so frustrating
03:54 for a lot of our best practices in urban planning, but at the same time,
03:58 there is no better place in the US to be studying and trying to intervene into some of these crises
04:04 that urban planning has wrought.
04:06 - Yeah, yeah, a lot of it was just, I imagine in the early days, just a free for all, right?
04:11 There was people, especially out in the West, right?
04:14 the US West, people just move out there and there's not a whole lot going on.
04:18 So when a city just neighborhoods go that way and not quite enough density for a lot of public transit
04:24 makes it challenging.
04:26 And then they become huge cities but they're stuck with those consequences.
04:29 Like LA and other cities. - Yeah, exactly.
04:30 And it's hard to retrofit a city once it's built out because those are people's homes and private properties
04:36 that you can't just cut from whole cloth, lay down the new city plan.
04:40 - Yeah, yeah.
04:41 Are there cities out there that are basically planned from scratch?
04:46 - Yeah, there are places like Brasilia, the capital of Brazil was a master planned city
04:54 in the modernist era, mid-century city planning where it's designed to look almost like the shape
04:59 of an airplane for the jet age, a modern city for the jet age.
05:03 - Amazing.
05:04 - But there's a wide range of how cities come to be.
05:08 Some of them are very organic, like you think old medieval cities have formed over centuries.
05:14 There are places like LA that built out very rapidly, or like in Chicago, all these straight lines
05:20 following from these 19th century ideas of rationality and orthogonal street networks.
05:28 And then there are these master plan cities where strong central leadership lets you lay it down
05:33 however you think is best.
05:36 - I imagine that how the cities are built has a lot to do with the people who helped construct the city
05:43 or there in the early days, how they perceived distance.
05:46 People perceived distance in LA by how far can you go in a car in 20 minutes.
05:51 The people perceived distance in Stuttgart, how far can you walk?
05:55 Maybe you can take a horse, potentially.
05:58 And that really probably changes things.
06:00 - Yeah, you know what, one way we talk about that idea of the perception of distance
06:04 and how the urban form shapes up is this idea of transportation technologies
06:09 And in general, you really see something of a death of geography.
06:15 That is, if you look at a 1990s suburb of Philadelphia or of Los Angeles, they look
06:22 very similar to each other.
06:24 You don't see that sort of local culture.
06:27 What you see is really building around the transportation technology and design aesthetic
06:32 of the era, rather than the local hands building the place up.
06:36 And it's, you know, when cars are how you get around, you build a city, it's designed for cars.
06:41 - Yeah, and then the cars get to be huge SUVs and they still don't fit.
06:45 All right.
06:47 Let's talk, you have this really cool visualization, which I'm going to link to in the show notes,
06:53 called City Street Orientations Around the World.
06:56 And it's got some pretty wild graphics.
07:00 You wanna tell people about this and kinda try to describe it for the folks listening?
07:04 Yeah, so what these show is the orientation of your city streets.
07:10 By orientation, we mean on a compass.
07:12 Like, do they point north, south, east, west?
07:15 Are they off that north, south, east, west orientation?
07:19 Or do your streets point more chaotically in all directions around the compass?
07:23 Like, there isn't a more consistent orientation.
07:26 So to visualize these, I used what's basically just a histogram, but it's a polar histogram.
07:33 So where a normal histogram will count your observations across some set of bins, for a polar histogram,
07:40 we've wrapped those bins around the circle of a compass so that each bin represents 10 degrees around the compass.
07:49 And there's 36 bins total for 360 degrees around the circle.
07:53 And then the length of each of the bars in those bins represents the frequency of streets
07:59 pointing in that direction in the city.
08:02 So in a place like Chicago or Beijing on screen here, most of the streets point north, south, east, west.
08:11 And what that tells us is it's kind of grid-like.
08:14 And this is common in a lot of cities around the world.
08:16 Even a lot of pre-modern cities would still orient themselves generally north, south, east, west,
08:22 just based on patterns where the sun was rising and setting.
08:25 - Yeah, I'm super surprised to see, for example, of Barcelona is pretty, not north-south,
08:30 but it's 90 degrees.
08:32 - Yeah, so in Barcelona, you see that 19th century and early 20th century, Eixample development.
08:40 So around medieval old Barcelona, El Defensor de la Dada laid out his grand city plan
08:46 that is fairly grid-like around it.
08:48 You can really see that here.
08:49 - Yeah, absolutely.
08:50 For people listening, some of them look like airplane fore-blade propellers,
08:54 and some look maybe like boat propellers, like really dense, but yeah, it's quite wild
08:59 to get a quick look.
09:01 Do we have LA in there?
09:02 We must, right?
09:04 - I have LA in the big one.
09:06 If you scroll down, we have American cities.
09:08 - Oh yeah, yeah, yeah.
09:10 Okay. - Yeah, there it is.
09:11 - That's a pretty stark contrast.
09:12 It's like all of them are propeller looking.
09:15 Other than Boston and interestingly, Charlotte.
09:18 Boston has a city. - Yeah, really interesting.
09:19 - Yeah, but Charlotte doesn't feel like a city like that to me, but what do we have?
09:23 - Yeah, so Boston is kind of one of those pre-modern, American cities. And its street orientation looks like that for a couple
09:32 of reasons. One, Boston is an agglomeration of multiple smaller towns over several centuries and each of them had grids to some extent but they didn't
09:41 all face the same way so they all got merged together. And then it has a lot of
09:45 hills that made it harder to build especially in early days and it would
09:49 really predated America's obsession with grids. Charlotte is kind of the opposite
09:54 it's late 20th century, the sort of winding streets and cul-de-sacs to make up those arterial roads
10:02 and then these sort of secluded in the center super blocks of subdivisions.
10:07 - Nice, well I'm happy to see that Portland, where I live, is like a perfect propeller blade shape.
10:12 You know, in our town, you have northeast, northwest, southeast, and then street numbers,
10:17 like northeast 120th street, right?
10:20 And it just screams we're on a perpendicular North Southeast West grid and it definitely shows up here.
10:27 And so this is some of the stuff that you came up with OSM NX.
10:31 - Yeah, so I used OSM NX to build all of these street network models from OpenStreetMap data.
10:38 And then OSM NX has built into it a visualization module that creates these kind of polar histograms
10:45 to understand how streets are oriented.
10:48 - Awesome, it's super interesting.
10:49 Let's, it's like it communicates to you just immediately as you look at it, it's great.
10:55 Let's start by talking about OpenStreetMap.
10:58 This is the backing data, obviously, the important backing data of your library.
11:03 So what's the origin of OpenStreetMap?
11:07 - Yeah, so OpenStreetMap started maybe 20 years ago or so.
11:12 For folks who haven't seen it before, I often describe it as being akin to Google Maps meets Wikipedia.
11:18 So it's a worldwide mapping project with global coverage.
11:23 Anyone can edit or contribute to it.
11:26 There is some editorial oversight as well to validate those edits.
11:32 But what's cool about OpenStreetMap is that its data license allows you to
11:37 pull data from it.
11:39 So unlike, say, Google Maps, which is fairly limited in what all it can draw,
11:45 you can really pull all of these features from OpenStreetMap.
11:48 And if you look, if you just zoom in on one of these cities here.
11:51 >> Yeah, let's go to Riverside, yeah.
11:53 - Yeah, it was surface streets, rail lines, building footprints, parks, train stations,
11:59 often grocery stores, restaurants, public schools.
12:02 All this stuff we're interested in from an urban planning perspective.
12:06 - Yeah, oh, it's really interesting.
12:09 And you can add in additional layers, like cycling maps or transportation maps
12:15 or topology maps, topological maps, all sorts of interesting things here.
12:20 - Yeah, exactly.
12:21 And it really lets you kind of hone in on the specific characteristics of the city
12:27 that you're interested in.
12:29 And there's a humanitarian layer that you can see, and this has been one of the big uses of OpenStreetMap
12:35 now for 15 years or so.
12:40 Often when there is a disaster in a less developed country, humanitarian aid organizations will go in
12:48 and use OpenStreetMap and contribute to it to create a kind of a digital layer
12:53 of the facts on the ground.
12:55 So the Haiti earthquake a few years back was a primary example of that, where it helped them understand where urbanization was,
13:03 where there were water pumps, toilets, and so forth, the kind of things that people need,
13:08 but aren't well mapped, often in these informal settlements.
13:12 - Yeah, oh, it's amazing.
13:13 We have, you know, I think everyone was amazed when Google Maps came out, right?
13:19 Before then we had MapQuest and all those things.
13:21 You'd have big little up arrow, up arrow, right arrow to like pull in tiles of the world and you know,
13:26 Google Maps and the world view that they had.
13:28 What was that product called?
13:30 Remember?
13:31 Where you could kind of fly, it was like a 3D thing.
13:33 You could kind of fly around in the early days but it was the same basic data thing.
13:36 Anyway, when that stuff came out, it was like, wow, this stuff is, you can now know about the world.
13:40 You can say, where did that road go?
13:42 I never went down.
13:43 You could just follow it and see or go to street view or whatever.
13:46 But a lot of that is locked behind.
13:48 however Google wants you to use it, right?
13:51 And it's not super accessible.
13:53 And so having something like this, where people can contribute, especially if they care about their neighborhood, right?
13:58 A lot of this people are contributing back into OpenStreetMap data.
14:02 - Yeah, exactly.
14:05 Yeah, so the nice thing with this is that it really is much more in that open source,
14:09 open data model of the world, which means we can do open science with it,
14:13 citizen science with it.
14:15 People who just notice that stuff is missing in their own community, you're able to fix it.
14:20 It's no longer that frustration of, well, when will Google get this thing right?
14:24 Or, hey, we have this new highway that was built outside my town.
14:27 When's it gonna show up?
14:28 I mean, it's up to you.
14:29 You can make it show up later today.
14:31 There is a drawback to that though.
14:33 The drawback is you get what we call sampling biases.
14:36 That is, you tend to see more coverage in places where people tend to contribute more.
14:42 And those things tend to be correlated with demographic characteristics.
14:46 Men contribute more than women.
14:47 higher income places more than lower income places just from a resourcing perspective.
14:53 And so one of the challenges we face as researchers using OpenStreetMap data for our analytics work
15:00 is keeping those in mind because it's hard to do comparative analysis.
15:04 If you don't know it's because the infrastructure is actually different in two places
15:08 or because it's been digitized to a different extent in two places.
15:11 - Right, right, right.
15:12 Just maybe higher fidelity information might skew some analysis one way or another, right?
15:18 - That's right, exactly.
15:19 And it tends to work pretty well comparatively for stuff like roads, streets,
15:24 whereas things like pedestrian footpaths or fresh food markets might be well digitized
15:30 in San Francisco and Portland, but probably not, say, in a small town in India
15:35 or Indonesia, let alone like a suburb of Des Moines, Iowa.
15:38 - Yeah, yeah, absolutely.
15:40 One of the apps that I use a lot is OnX.
15:43 You know OnX?
15:44 - Yeah, OnX is cool.
15:46 You can, I do a lot of off-road motorcycle riding and it'll show you all the little trails and stuff,
15:52 but someone's got to go and enter all that information.
15:55 And so some places are super well mapped and others are not on the map at all.
16:00 But I imagine they probably get some of their data from OpenStreetMap as well,
16:04 although I haven't been able to tell.
16:06 - Yeah, it's a good question.
16:06 A lot of people downstream do use OpenStreetMap data because of its quality and accessibility.
16:13 - Yeah, Mark out in the audience is asking, is there some kind of mobile app that kind of gives you
16:18 access to the OpenStreetMap data?
16:21 Kind of like Google Maps.
16:21 - Yeah, there are some mobile apps for it.
16:26 I don't use them.
16:27 It has some challenges with routing because it is publicly editable.
16:32 Sometimes there'll be little breaks in the connections where it's not digitized quite right.
16:37 But there are routing apps.
16:38 You could replace, say, Google Maps on your phone with OpenStreetMap and you can route with it.
16:42 It works particularly well in big cities and places like Europe and the US,
16:47 less so in small rural areas or in less developed countries.
16:51 - Yeah, yeah, the onX thing is, it doesn't really route you, but it shows you on a map
16:56 and then it shows you where you go on it, and if you choose to stay on the path,
16:59 then it'll really help you, but it doesn't really say, you can't say, "Give me directions."
17:05 At least not when you're off-road.
17:07 If you're on-road, maybe it'll fall back to something that works, but yeah, amazing.
17:11 - So what's the licensing story behind all this data?
17:14 How, the name probably gives a lot of it away, OpenStreetMap, but how is this data usable?
17:19 What can people do with it?
17:20 - Yeah, so it's basically usable for non-commercial purposes with attribution.
17:26 So for example, as researchers, when we are using these data, we just need to attribute where it came from,
17:35 OpenStreetMap and its contributors.
17:38 And I ended up including that license information somewhere on the read me for OSMNX,
17:45 because I think a lot of time people will look over these underlying data sources and tools
17:50 when they're using these kind of downstream, downstream tools and apps.
17:56 So because of that, I just wanted to call it, yeah, you can see it on screen here.
18:00 So I mentioned OpenStreetMaps open data license requires that derivative works provide proper attribution,
18:06 which is really nice 'cause it's a very easy thing to do for the cornucopia of data that they make available.
18:11 - Yeah, yeah, that's amazing.
18:14 This portion of Talk Python To Me is brought to you by the folks at Posit.
18:18 Posit has made a huge investment in the Python community lately.
18:21 Known originally for RStudio, they've been building out a suite of tools
18:25 and services for Team Python.
18:27 Over the past few years, we've all learned some pretty scary terms, of squatting, supply chain attack, obfuscated code, and more. These all orbit around the idea
18:38 that when you install Python packages, you're effectively running arbitrary code off the
18:43 internet on your dev machine, and usually even on your servers. The thought alone makes me shudder,
18:48 and this doesn't even touch the reproducibility issues surrounding external packages.
18:53 But there are tools to help. Posit Package Manager can solve both problems for you.
18:58 Think of Posit Package Manager as your personal package concierge.
19:02 You use it to build your own package repositories within your firewall that keep your project safe.
19:07 You can upload your own internal packages to share or import packages directly from PyPI.
19:12 Your team members can install from these repos in normal ways using tools like pip, poetry, and uv.
19:18 Posit Package Manager can help you manage updates ensuring you're using the latest,
19:23 most secure versions of your packages. But it also takes point-in-time snapshots of your
19:28 repos, which you can use to rerun your code reproducibly in the future.
19:33 Posit Package Manager reports on packages with known CVEs and other vulnerabilities
19:38 so you can keep ahead of threats.
19:40 And if you need the highest level of security, you can even run Posit Package Manager in
19:44 air-gapped environments.
19:46 If you work on our data science team where security matters, you owe it to you and your
19:50 org to check out Posit Package Manager.
19:52 visit talkpython.fm/ppm today and get a three month free trial to see if it's a good fit.
19:58 That's talkpython.fm/ppm.
20:01 The link is in your podcast player show notes.
20:03 Thank you to Posit for supporting the show.
20:07 If I wanted to build a commercial product, I wanted to build on X squared or whatever,
20:12 where I could have people drive around and use that and map it and make notes and maybe contribute back.
20:17 Do you know what the story, I mean, obviously not a lawyer, right?
20:20 But what's the, would people be able to do that?
20:23 Or is there a paid API or how does it work?
20:25 - It's a good question.
20:27 So I know in practice people can because I see commercial tools that use OpenStreetMap data all the time.
20:32 I don't know the details though because one of the nice things about being in academia
20:36 is you end up being so divorced from the commercial world that I don't have to worry about that.
20:41 - Yeah, that's pretty good, right?
20:44 Just do your research, answer interesting questions and follow the lead, right?
20:48 - Those are the benefits, yeah.
20:49 It comes with drawbacks, but those are the benefits.
20:52 - Yeah, I'm aware of some of the drawbacks as well, for sure.
20:55 All right, well, so that is the foundation of this project, OSMNX.
21:01 Tell us about your project.
21:03 - Yeah, so OSMNX is a Python package that lets you interact with OpenShift's APIs
21:10 to make it really easy to download data and build models or a data frame of those data.
21:17 So the two main things that it does is it can create a graph model.
21:22 So that is a model of a network like streets or rails or highways or anything else.
21:30 Or you can create a geo data frame.
21:31 That's kind of a spatialized version of a pandas data frame using GeoPandas of OpenStreetMap features.
21:38 So that's all the stuff in OpenStreetMap.
21:40 It could be points, lines, polygons.
21:43 It could be traffic signals or parks or schools or roads.
21:48 But you can download either of those and then do whatever it is you wanna do with them.
21:53 And OSMNX has some other stuff built in.
21:56 So it has a simple routing engine built in, some visualization tools.
22:02 You can work with elevation so that you can figure out street grades.
22:07 Particularly relevant, for example, if you're a cyclist and you're trying to choose a shortest path
22:12 that maybe minimizes those grades and so forth.
22:15 - Even for cars, Google started offering a, this path saves, uses the least fuel,
22:22 or in my case, the least electricity, whatever you put into it to make it go.
22:28 That's also, uses like that would be interesting.
22:32 - Yeah, exactly.
22:33 I mean, kind of superficially, we always imagine that our shortest path to get somewhere
22:37 is the one that minimizes our travel time.
22:39 But in reality, there are a lot of other things minimize including fuel consumption or for pedestrians.
22:45 Empirically, we know that people will take longer routes if it's a nicer route.
22:50 We're not trying to shave off a minute to walk along the arterial road with the aluminum.
22:55 >> You go through the fence by that old abandoned factory back here, and you go straight across, it'll be great.
23:03 You'll save a minute.
23:05 >> Exactly.
23:07 >> Amazing. Okay. Yeah, super fun.
23:09 As part of those visualizations, Can you draw maps?
23:13 You can, yeah. So it has some mapping capabilities.
23:17 You can also plot routes on it.
23:20 It ties into a folium package, which is a Python package to develop leaflet JavaScript web maps.
23:28 So you can do interactive web maps from it.
23:31 And then on top of OSMNX, there's a cool downstream package called Pretty Maps that I'm not affiliated with,
23:39 but does really nice, aesthetically pleasing mapping.
23:44 It's really customizable and really cool.
23:46 >> Okay. Do you have a gallery or something?
23:48 >> I do. Yeah. So if you scroll up a little bit, there's a link to the examples gallery.
23:53 It's on GitHub, OSMNX examples.
23:57 >> You can pull up different notebooks?
23:59 >> Yeah, exactly. So each notebook covers a different theme of analysis.
24:03 It would be commonly done with OSMNX.
24:06 >> Oh, nice. Yeah, that's really cool.
24:07 People just pull up the notebook and see how it works.
24:09 What one do you think is a good representative one to maybe like get a sense of how to work with it?
24:13 - So we count from zero 'cause we're in the Python world.
24:16 So notebook zero zero is a good place to start.
24:19 That kind of steps through some of the basic functionality that most users would be interested in starting with.
24:26 - Sure, okay.
24:28 Yeah, so people can download these notebooks in the examples repository, which I'll link to.
24:34 - Yeah, exactly.
24:34 So there's a getting started guide in the documentation after kind of reading through that,
24:40 that examples gallery is a really good way to just kind of get a sense of code
24:44 that you can copy and paste to get started.
24:46 - Okay, excellent.
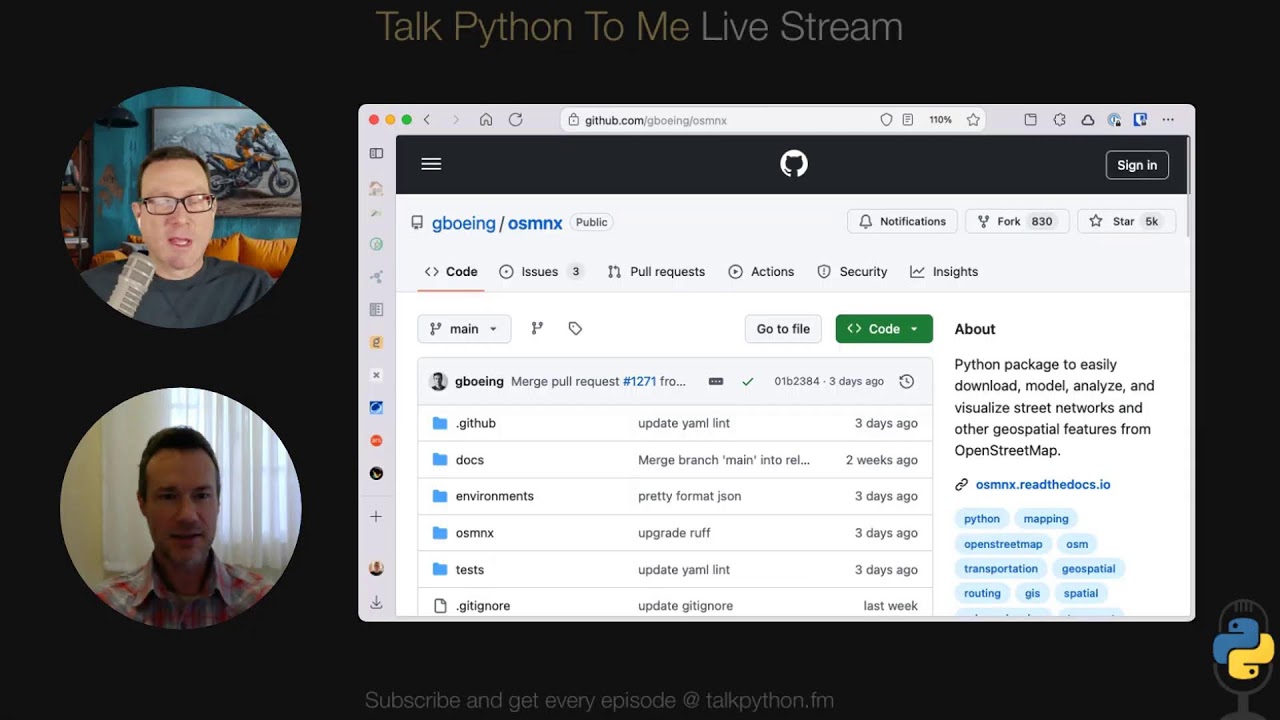
24:47 And 5,000 GitHub stars, almost a thousand forks.
24:51 You know, that's quite a bit of traction.
24:52 Congratulations.
24:53 - Yeah, thanks.
24:54 I mean, it's weird.
24:55 This is very much my side hustle, but it's also really been a labor of love
25:00 for a long time now.
25:02 There is no reward in academia for creating open source packages.
25:08 I think if you explain it very carefully to academic power brokers, they say,
25:13 "That makes sense, that's great, that's a good contribution." But prima facie, that doesn't mean anything.
25:18 They have no idea.
25:19 - It's really, it's tough to put it on a 10-year application, right?
25:22 - Yeah, it makes it sound like you're wasting your time and you don't understand what you're supposed to be doing
25:27 with your time.
25:29 (laughing)
25:29 - Like, but you understand, the research is so easy now.
25:32 - Yeah.
25:33 I mean, that's really how that started.
25:34 I thought I was gonna be able to do this research without having to create my own tool,
25:39 but it turned out I was not able to.
25:41 - Interesting, what was your background in programming at that point?
25:45 - Yeah, so my undergrad and master's degree, I did computer systems and information systems.
25:53 I worked in the private sector for a few years and decided to go back to school
25:56 for my PhD in urban planning.
25:59 But when I was coming into that, I was pitching myself as this sort of like
26:03 data science analytics kind of person in that world, which was starting to get kind of hot at that time.
26:09 So it ended up being a nice fit.
26:12 And when I started my dissertation, I had this dissertation proposal that was, you know,
26:19 very, very nice, this kind of big grand proposal.
26:21 I ended up only doing the first chapter of it for my entire dissertation
26:25 because of how these things expand to fill space.
26:27 And when I pitched my proposal to my dissertation committee, there are a lot of assumptions about the tools
26:33 that were out there.
26:33 You know, I knew OpenStreetMap was out there.
26:35 I'd seen there were some tools to download and work with data from it.
26:38 So I was pretty sure we'd be able to create a nice mathematical graph model
26:43 of OpenStreetMap data automatically.
26:46 As I started on my first week of making that happen, I realized the tool did not exist.
26:51 And in fact, it was profoundly difficult to get data from OpenStreetMap.
26:56 If you wanted to filter it, like I just want pedestrian paths, not everything.
27:01 I just want drivable streets, not everything else.
27:04 And so the first year of my dissertation work was creating the first version of OSM and X accordingly.
27:11 - So you must have grants and stuff for your research as academics do.
27:17 How much time are you allowed to sort of bring some of that into adding features back to this project?
27:24 - Yeah, back to the benefits of academia, the nice thing is as long as you get
27:29 what they want to see done, as long as those outputs are there, your time is really completely your own, right?
27:34 So you teach a couple classes, you have to publish a few papers a year.
27:37 Other than that, you're free to do whatever.
27:39 So I do get grants, helps me fund my graduate students.
27:44 Ironically, it's very hard to get grants to do this kind of open source software,
27:49 open commons development.
27:52 Everyone talks about it, and especially grant funders know how much we all use this stuff,
27:56 and they really like it, but it just doesn't get funded.
27:59 So what you have to do is you have to kind of hack it in or sideload it, I guess, into your grants
28:06 where the grant will answer this empirical question that's near and dear to the funder's heart.
28:10 But to do that, we have this tool building phase for six months, be able to unlock the analytics for it.
28:16 And so that's really how a lot of the features and a lot of the modules have been added to OSMNx over time.
28:23 There's this new project I ought to do, so we'll just build it into the package.
28:27 - Right, we need to be able to answer new questions, so we gotta have new ways to get to the data, yeah?
28:32 - Yeah, exactly.
28:34 And it is poorly incentivized in academia, but academia has really been home
28:39 to a lot of open source tool development, especially niche tools, you know,
28:44 from stuff like Astropy, for the astronomers and astrophysicists, to things like PySAL,
28:51 the Spatial Analysis Library in Python, but a lot of things that academics
28:54 have kind of been at the forefront of, But for us, it's always a side hustle.
28:58 - Right, stuff with biology, psychology, a lot of the sciences, I imagine.
29:02 - Yeah, yeah.
29:02 - Working on open source projects like this feels to me very much like the concept
29:08 of funding basic science, right?
29:11 Not funding, we need to solve this problem so we can create a bomb or new energy or go to space,
29:17 but we're just doing it 'cause we need to understand the science better and it'll help us then apply it eventually,
29:23 maybe, at some point, right?
29:24 Same sort of thing here.
29:26 If these exist, it will supercharge the urban planning space to a huge degree, but getting people to fund it
29:34 or to care about helping build that up, I imagine it's a little bit frustrating.
29:39 - No, that's exactly, I mean, the way I talk about it is it really is a sort of basic science work
29:44 that everyone takes for granted as though these things just exist, right?
29:49 This tool just exists, we don't know where it comes from, it has an API, that API just exists,
29:55 And it really kind of obscures all of these human decisions and social structures and processes and institutions
30:03 that make it difficult or make other things easy and really shape what we end up being able to work with.
30:09 - Yeah, absolutely.
30:11 Well, someday maybe you can put down, yeah, I only wrote two papers, but I have 10,000 get up stars, so.
30:18 - Yeah, well.
30:19 - Here's your tenure assignment, you know.
30:22 This is the future, I'm there for it.
30:26 - It's a race between whether ChatGPT overtakes all of that stuff or you get there and people,
30:31 I don't know, that's a whole different deal.
30:33 We can talk about that later.
30:36 Let's talk about the Overpass API though.
30:38 That's the way that you get data from OpenStreetMap.
30:43 What is this?
30:44 - Yeah, so the Overpass API is another open source tool OpenStreetMaps database and download stuff, basically,
30:56 any of OpenStreetMaps features.
31:00 So what's nice about Overpass is that there's some public instances that you can just query as a web API.
31:07 You can also host it locally if you want to work around throttling limits, rate limits.
31:15 Challenge with the Overpass API--
31:18 you can see a little bit of it here on screen-- is that the OverpassQL, it's query language,
31:23 can be really hard to work with to do complex stuff.
31:28 So this is a fairly simple one.
31:29 On screen we can see there's a bounding box with some lat long coordinates
31:33 to explain where we wanna download data from.
31:37 The output will be in JSON format.
31:39 The server timeout is 90 seconds.
31:42 Big queries can take a long time to run.
31:45 And then we're querying here for way elements.
31:48 So way would be a line feature in OpenStreetMap.
31:53 Any line, it could be street, it could also be the building footprints boundary line.
31:59 - I see, the property lines are zoning or whatever, right?
32:04 - Yeah, exactly.
32:04 Anything represented as a line.
32:07 And so we get that back out, it'll be kicked out as a JSON.
32:12 And what OSMNx does is it works with this overpass API to try to automate some of these queries.
32:18 So rather than having to write the query yourself, download the data, and then convert that raw
32:22 OpenStreetMap data into a useful data format, like drop it into Geopandas or into a NetworkX graph,
32:29 it assembles all of that under the hood.
32:31 It's open source, it's well-documented.
32:33 I have a few peer-reviewed articles about the exact process.
32:36 So we don't all have to reinvent the wheel trying to work with this data
32:39 because none of this is automatic.
32:41 And in fact, 10 plus years ago, People were very laboriously having to write
32:46 these long scripts.
32:47 - You know what I'm gonna do?
32:48 I'm gonna get a grad student and it's gonna be their job for the summer to convert this to Excel or MATLAB for me.
32:55 Something like that.
32:56 - Yeah, exactly, yeah.
32:57 Grad students are great.
32:59 But what's much greater, I think, is having one or two lines of code to replace your grad student for the summer.
33:04 - 100%, let them do meaningful work that they also like, right?
33:07 - Yeah, that's the whole--
33:08 - Find it out.
33:09 Yeah, yeah, that's fantastic.
33:10 As I look at this and think about this, It feels to me like OSM and X is a little bit like an ORM is to SQL and databases.
33:20 Right?
33:20 Like, let's you, you think more in Python language and concepts and don't
33:26 worry about the query syntax and the data and all that kind of stuff.
33:29 Is that a reasonable analogy?
33:31 >> Yeah, that's a good way to put it.
33:32 And, and the goal for doing something like that is to try to democratize
33:37 doing some of these analyses.
33:39 You know, open street map data are really amazing.
33:41 Overpass is an amazing resource, but it's really hard to work with unless you have some software development
33:48 or database experience.
33:50 And a lot of urban planners or urban geographers or urban sociologists do not.
33:55 They have great questions, they have great theory, they want a hypothesis test, right?
33:59 But we limit science if our tools are too difficult to use or the right data are too hard to access.
34:06 - Yeah, back to that basic science ideas, right?
34:09 - Yeah.
34:10 - Yeah, so for something like this, what OSMNX does is it puts that kind of overpatch query
34:16 into much more natural language.
34:17 Since Python is so readable in the first place, you can just say something like graph from place,
34:23 give it a city name, say Pasadena, California.
34:27 My network type will be drive, and then just like that, I have that drivable street network model
34:34 within the city limits of Pasadena.
34:36 - Right, yeah, that sounds entirely more usable.
34:39 - And one of the things you said is that it's, it can be pretty expensive to query the Overpass API,
34:45 and so your library caches that stuff locally, right?
34:48 - That's right, yeah, so expense in the computational sense, all these things are free to use.
34:55 - That's what I mean, computationally expensive.
34:56 - Yeah, exactly, and there's a lot of time complexity to it as well.
35:01 So what we do is we cache everything, which helps you avoid rate limiting.
35:05 let's OSMNX be a good neighbor to these free public commons resources that are out there.
35:12 - Yeah, interesting.
35:13 It sounds almost like you could have a Docker containers for different cities that are preloaded
35:19 with all the data that might be interesting to just instantaneously answer a bunch of questions.
35:24 - Yeah, which is really my work.
35:26 So a lot of what I do will be, I study every street network for every urbanized area in the world, right?
35:33 So we'll have like eight to 9,000 of these large urban models.
35:38 And so I'll just have things cached locally so that the model building and analytics
35:43 are really at the forefront rather than the downloading and querying for a day.
35:47 - Right, it's not only lets you be a good citizen and not hammer on OpenStreetMaps API,
35:52 but it just lets your stuff work faster.
35:54 So the incentives are aligned there, right?
35:57 - Yeah, and in fact, a lot of the time when people first use OSMNX, you know, you'll download the, say the model of Los Angeles, California,
36:05 and it takes a minute to run the query on their server, download whatever,
36:09 a hundred megabytes of data, and then build that graph, theoretic model, do all the spatial stuff to it. but after that,
36:18 it's nice and fast the next time that you do it, because you're able to skip all of that pre-processing from the cache.
36:23 It probably puts it into some super efficient data structure.
36:29 or some others, maybe dictionaries, who knows, right?
36:31 - Yeah, yeah, and we use spatial indexes to accelerate all of the spatial queries locally too,
36:39 as well.
36:40 - Is that built into Geopandas?
36:42 - Yeah, built into Geopandas, there is an R tree, which is probably the most common spatial index.
36:48 But in addition to that, we also use SciPy's KD tree.
36:54 They have like a C implementation of a K dimensional tree that we can do nearest neighbor search.
37:00 So for example, Google Maps, you say from my origin to my destination, we can do the same kind of thing.
37:04 Say from this point to that point, we'll snap the nearest neighbor on the network
37:08 and then solve a path between them.
37:10 - Okay, so just the k-nearest neighbor algorithm sort of applied to, what is that,
37:15 the vectors of the intersections or something?
37:19 Or then you--
37:20 - Yeah, so normally when you do origins and destinations, you would snap to a node in the network.
37:25 So the nodes would be like the intersections and dead ends.
37:28 And then the edges would be the links, the street segments that connect everything together.
37:33 And when you solve a path on a graph, it would be from a start node to an end node.
37:41 Then you'd minimize it by something, either the fewest hops or the shortest distance
37:46 or the shortest travel time.
37:47 If you incorporate, say, speed limits, everything else, you can bring in congestion information
37:51 to minimize traffic congested travel time or minimize going up and down hills or anything else.
37:58 - Excellent.
37:58 If I got this data downloaded and I wanted to put it into a proper database,
38:04 and by proper I mean one that is its own process, different machines can talk to it in parallel and whatever,
38:09 you know, like Postgres or Mongo or something, are there good databases that you would recommend
38:14 or that you've tried, like EdgeDB or Neo4j or graph databases the right way to go,
38:19 or what do you think?
38:20 - It depends on what you're trying to do In terms of OpenStreetMap features,
38:25 so if you're just downloading features and you're not worried about, you say those topological relationships between things,
38:30 like in a street network, any tabular data structure will do.
38:36 Any kind of like SQL database will do just fine.
38:39 For a graph model, yeah, you'd want some kind of graph database because they can handle graph algorithms
38:46 to do stuff like routing or other kinds of graph analytics like understanding connectivity on the network.
38:52 - Yeah, I have this, given this node, tell me all the things that are connected to it.
38:56 Like that, those kind of questions could be answered. - Yeah, those kind
38:58 of questions, yeah. - Right, yeah.
38:59 Yeah, they're kind of pre-computed by the indices in the structures.
39:03 What about bringing in other data?
39:06 You know, what if I have real estate data that doesn't come from OpenStreetMap,
39:10 but I want to pull that in and overlay it with, say, zoning information,
39:15 overlapped with census data that gives me revenue, you know, how much that person in that area
39:21 makes per year on average or something like that.
39:23 Can you answer questions like that?
39:25 - Yeah, really common use case.
39:26 So OSMNX can kind of do that by itself, but mostly as a tool in the toolkit to do it.
39:32 So, you know, a common way that we often will do this is for accessibility analyses.
39:37 So for example, here at my house, how many grocery stores could I access
39:42 within a 15 minute walk?
39:44 And it gives you a sense of, you know, how car dependent or not a place is.
39:48 And also we can start looking at food deserts communities where people don't have access to fresh food.
39:53 So for that, what you're doing is you have a model of the network, and then you also
39:57 have all of this point of interest data, right?
39:59 So where all these amenities are located, you would then snap them, load them onto
40:04 the graph, and then you can calculate accessibility by looking at where those
40:08 things are located.
40:09 And you can either look at cumulative opportunities within some time horizon or
40:14 distance to the nearest opportunity.
40:16 You can put different decays on it, like the utility of it being so far away, drops
40:21 the linear decay the further I have to go or a non-linear decay if it really drops off fast.
40:26 But it's exactly that.
40:27 - Yeah, if a grocery store is three miles away, it's not one third as useful as one that's one mile away.
40:32 It's a little bit more to carry your groceries that far.
40:35 - And similarly, there's marginal utility for the 30th grocery store that you can reach.
40:40 Doesn't give you that much benefit over the 29th that you can reach.
40:43 Whereas the first and second are very valuable.
40:46 - Yeah, if it goes from zero to one and one to two, those are big jumps right there.
40:50 - Yep.
40:50 - Okay, very interesting.
40:52 How about some projects that people might be thinking about?
40:57 They look at this data and they're like, "Wow, this looks really detailed and neat,
41:00 "and we have all these different aspects we can ask about," but maybe they just wanna play around.
41:06 - Yeah, I mean, hopefully, if you look at the Getting Started Guide or these usage examples,
41:11 you'll see it's really easy to play around, two, three lines of code, and you have a visualization of your local street network.
41:18 things that we've done in my lab at USC that may spark some interest. We look at
41:24 air pollution exposure and driving patterns in Los Angeles to try to understand you know who's driving and where and then in turn who is exposed to
41:33 that tailpipe, those tailpipe emissions from those cars. So we use OSM and X to
41:39 model those street networks to simulate those trips and to look at what census
41:44 tracks that stuff goes through. We also use it for studies of urban form. So that is kind
41:50 of the shape, texture, density, the grain of a city. I have this series of square mile
41:57 visualizations of different cities around the world. And you can really quickly see
42:01 how different forms of urbanism look relative to each other. So a place like Irvine, California,
42:10 in Southern California has this really coarse-grained street network.
42:15 A place like Venice in Italy has incredibly fine-grained, like spiderweb street network.
42:22 Stuff like that really helps to kind of convey these different modes of urbanism and urbanization.
42:28 We also use these to look at disaster resilience.
42:32 That is, different street networks will be better if things start going wrong around
42:37 Things with more redundancy, more connectivity built in are easier to route around if parts start failing
42:43 in a fire, in an earthquake.
42:45 And so we can capture some of these characteristics and then make recommendations to planners and policy makers
42:50 about how to make your street network, how to intervene in it to make it more resilient.
42:54 - Yeah, in my area, there's an East-West highway, one of them, very few, that goes from the city west.
43:01 It has to go through this mountain tunnel and it's two lanes each way in the mountain,
43:05 or three lanes in the mountain tunnel.
43:06 and there's even on a Saturday afternoon, there's stopped cars trying to go through that tunnel.
43:12 And those are on good days.
43:13 Imagine if there was an emergency, it would just be done.
43:16 - Yeah, that's the 26, right?
43:18 - Exactly, it is the 26.
43:20 - Yeah, I used to live in Portland.
43:22 I lived in Goose Hollow, and my gym was in Beaverton, so I would have to go through that tunnel to go work out.
43:30 It would always be like, you know, one of these days, one of these days.
43:35 - Exactly, yeah, I live about a mile from Goose Hollow up through that tunnel.
43:39 So yeah. - Oh, cool.
43:40 - Yeah, yeah, very cool.
43:41 Yeah, but there's just, and that one's hard to fix because there's houses all along there.
43:45 It's a big hill, hard to go over it.
43:48 You know, it would take a lot of willpower to make another tunnel.
43:51 - Yeah, interesting thing.
43:52 I did my PhD at Berkeley, and there is another tunnel there that goes from that kind of inner East Bay,
43:59 Berkeley, Oakland border, out to the further East suburbs like Orinda, Moraga, and so forth.
44:05 And that tunnel is really old.
44:07 I mean, it's, I don't know, 80 years old, maybe something like that.
44:10 And they determined that when the big one does eventually hit, it will fail, it will collapse.
44:16 And it's not, it's cost prohibitive to actually prevent that from happening.
44:20 So the idea is it will collapse and crush everyone in that tunnel, and they will then build a new tunnel
44:26 at that point when they have to.
44:27 - Oh my goodness.
44:28 - We have a lot of that to look forward to.
44:29 (laughing)
44:31 - Yeah, just go quickly when you're in the tunnel.
44:33 Get out of there.
44:34 >> I always did.
44:35 >> Amazing.
44:38 All right.
44:39 Let's talk real quickly about integrating OpenOSMNX with other data science tooling,
44:47 right?
44:47 We have so many different things.
44:48 We have PyTorch, we have Pandas, we have Polluters, all the different things.
44:54 Like what are the different integration features?
44:56 You know, you talked about data frames.
44:57 That sounds like Pandas and GeoPandas, right?
45:01 That's one sort of path across those things.
45:03 - Yeah, so OSMNX is built primarily on top of three things.
45:10 It's NetworkX for the graph models, Geopandas for the spatial data frames,
45:17 and Matplotlib for the visualizations.
45:21 In the spatial Python world, most stuff happens in the pandas ecosystem because Geopandas and PySAL and similar tools
45:31 are very pandas-oriented.
45:34 I know there's been some work toward geopolars, but it's kind of in its infancy,
45:39 as far as I know, to this extent.
45:41 But that'll be great when that's available.
45:44 NetworkX is another funny one because it's a pure Python implementation.
45:49 It has a lot of loops, and so it can go really slow for calculating some of these big time complexity graph algorithms,
45:56 things like betweenness centrality, where you have this massive OD native,
46:01 basically all the nodes to all the nodes.
46:03 - Yeah, yeah, some combinatorial craziness.
46:06 - It ends up being very time consuming to calculate those kinds of things
46:10 for a metro area sized network model.
46:14 So we'll integrate with other tools.
46:17 iGraph does that in C.
46:20 Also using tools like QGraph where you can do it on the GPU instead can be really fun. - Oh wow, okay, yeah.
46:27 - But it's limited because of the weighting scheme that you say, I want to minimize travel time
46:34 or stuff like that.
46:35 - I see.
46:37 - Yeah, and then also integrated with Folium to create interactive leaflet web maps out of the box.
46:46 - Yeah, I wonder how that the free-threaded Python stuff will affect some of those computational things.
46:52 Like that everything compared with everything else sounds like a so-called embarrassingly parallel
46:58 sort of problem, right?
46:59 And so, you have 10 cores, so let's just do 10 blocks of them all in parallel and you know.
47:06 - Yeah, so that's what we do when we do it in pure Python.
47:09 So we'll use multi-processing generally with all your CPUs.
47:14 The only challenge is that your OD matrix, your origin destination matrix is growing
47:20 at this exponential rate, but then there's a linear number of cores, so going from one to 24,
47:25 you're dividing by a factor of 24.
47:27 But when you have say a million nodes times a million nodes in your graph,
47:32 it's going to take a long time.
47:34 - It's still gonna be slow, but it's--
47:36 - You've got from months down to weeks.
47:39 - Yeah, I mean, you're still dividing it by the number of cores, but it doesn't necessarily mean it's super fast.
47:45 Although the GPU stuff seems like it could absolutely fly, right?
47:48 - Yeah, that makes a big difference.
47:50 And I think that's really the area of growth where the handling, I mean, basically getting out
47:55 of Python loops in the first place is the biggest area of growth.
47:59 And then doing things on a, since these are really just very simple linear algebra problems,
48:04 being able to do them on a GPU makes it much more efficient.
48:07 - Yeah, did you hear about this thing, this new NVIDIA, what, I don't know what it's called,
48:12 Project Digits, where they announced a $3,000 desktop AI computer?
48:18 I mean, they call it AI, but really it's just a GPU.
48:20 - That is, no, I hadn't heard about that.
48:22 - And this thing, it's the size of a Mac mini.
48:25 It's this, if you look at the pictures, a little bit of a golden thing.
48:28 It's kind of clever they made it gold, but that's a massive computer sitting next to you.
48:35 - Yeah.
48:36 - You could run that.
48:36 This is pretty interesting actually, I think.
48:39 - Yeah, yeah, that is.
48:42 I mean, it's shocking too, because it looks so much smaller than just an Nvidia card in your desktop.
48:49 - I think it basically is just the GPU.
48:52 - Right.
48:52 - Nothing to do with graphics.
48:53 just remote into it over, I don't know, a terminal or however you, or maybe you set
48:58 it as the Docker host and then you just do Docker locally, but it runs there, you know,
49:02 that type of thing.
49:03 I don't know how it works, but I kind of want one.
49:05 >> Yeah.
49:07 I mean, it looks sexy enough.
49:08 Of course you would want one, right?
49:09 >> Of course.
49:10 But if you had questions like that, if you say I have a million nodes and I could run
49:13 that on a GPU, getting something like this that's, you know, kind of the H100 style of
49:18 like the really large just meant for compute, not really a graphics card.
49:23 like that would really unlock some interesting options.
49:25 Yeah, totally.
49:26 I mean, yeah.
49:27 So I have a, a GeForce card in my desktop that I'll pass them and that stuff locally onto.
49:33 But, another one of the academic benefits at USC, we have a high performance computing cluster that, I can schedule tasks to run on that,
49:43 say over winter break and then come back in January and, and the month of, of, 1000 CPUs is all done.
49:51 That's amazing.
49:52 And we had a mainframe, a silicon graphics mainframe when I was studying math that we could all work on
50:00 in this group of maybe 10 of us.
50:02 And it wasn't as big as what you're saying, but it was a quite expensive, big machine.
50:07 It had its own room and it was really allowed to go into that room.
50:10 And I remember we came in to, I came in to do whatever I was working on as a grad student or whatever, I think I was a senior.
50:17 Anyway, I came in to work on my project and nobody could access it.
50:21 and it was still in there making loud noises like it was running, but it acted like it wasn't running.
50:25 And so I'm like, what is going on?
50:27 One of the other grad students had run a job like you're talking about, but they were having trouble getting into work
50:32 'cause they were math people, not programmers.
50:34 And they started logging everything.
50:36 And there were no limits on what people could do to the computer, the people that set it up.
50:41 And so what had happened is it ran 100% CPU on all the cores all night logging
50:46 until it ran out of space.
50:47 And then apparently the computer won't run anymore if it has zero more bytes.
50:50 needed some temp file or something.
50:52 And so it just, it was just done.
50:55 I imagine you guys have more guardrails than that.
50:59 - Yeah, a lot of guardrails.
51:00 I would love to try to do something like that just for the yuck sometime, but we got a lot of-
51:06 - The admins of that computer would not please with that grad student.
51:10 - I can only imagine.
51:12 - It took a long time to get it going.
51:14 It's like a day of work to get it turned back on.
51:16 'Cause they didn't even know what was wrong with it at first it just wouldn't turn on.
51:19 - Oh well, jumping back a moment to the, no, that's not the one I wanted to copy,
51:25 to the integration, have you considered working with narwhals?
51:30 - I looked into narwhals recently.
51:32 My understanding is one of the things that does well is it kind of abstracts away from pandas versus polars,
51:38 so you're less tool dependent, right?
51:40 - Yeah, and it also lets people who want to consume your library, who want to do their work in polars,
51:46 talk polars to your project, and people want to do pandas, talk pandas, as well as QDF, modem, pyro, and other.
51:53 It kind of is an adapting layer, so people can work in their native framework
51:58 and then talk to you.
51:59 - Yeah, I mean, yeah, on paper it sounds great.
52:02 I haven't played with it yet, other than just being familiar with it, but I mean, that sounds like the ideal, right?
52:07 We shouldn't be enforcing these certain APIs or languages on people.
52:11 - Yeah, it does look interesting.
52:12 I believe its foundational internals are maybe just the API, But there are Polars, not pandas,
52:19 so maybe that's not as good of a fit.
52:20 But it could be an interesting thing to look in the future to make it native to
52:25 all the different DataFrame libraries that people want to talk in.
52:28 >> Yeah, definitely.
52:30 >> Are you going to need a new grant?
52:31 >> Yeah. Here's the basic science stuff.
52:34 If I'm interested in network models, I don't know about getting into the nuts and bolts of
52:39 which DataFrame API we're going to have people use.
52:43 - Yeah, yeah, absolutely.
52:47 All right, well, let's close this whole conversation out by talking about something that I know
52:53 is on a lot of people's minds, and that's LLMs.
52:56 And what do LLMs mean for this mapping data and the types of questions you can answer
53:02 in OSMNx, all these types of things?
53:05 Like, how's that shaping your world?
53:08 - Yeah, so two ways that I like to think about it.
53:11 One is what LLMs have to offer us today.
53:14 And then one is what LLMs have to offer us, say five to 10 years from now.
53:18 That is, how do we future-proof ourselves, our careers, our livelihoods?
53:23 And I mean, or just optimistically, how do we really get ahead of it to take advantage
53:28 of nice things that they'll have to offer?
53:30 Today, I am deeply unimpressed with most of the use cases that I see for it.
53:36 I think that the outputs only look good to people who aren't experts and don't know how wrong it is.
53:42 Does some things well, you know, like having a co-pilot while you're coding
53:45 and having it recommending.
53:47 That's nice.
53:47 I mean, it's like tab complete from years ago.
53:49 It's the same kind of thing, just iterating.
53:52 But you know, when someone tells it to, you know, here's the prompt, generate my algorithm for me.
53:58 Two things.
53:59 One, it very often doesn't do that good of a job even at this point.
54:02 And number two, if you don't enjoy doing that kind of thing, I'm not sure why you're in software development
54:09 in the first place.
54:10 - I know.
54:10 - For me, when I interface with it, it's usually in the classroom.
54:14 And you'll have, so, you know, people like to complain kids these days.
54:17 It's the same way it was when I was in school.
54:19 You know, a third of the class loves a subject.
54:22 They're just killing it.
54:23 They wanna be there.
54:24 They want a job in this.
54:25 A third of the class, they're like, "Well, it's a required class.
54:28 "I'll try to do what I can." And a third of them say, "I don't know why I'm here.
54:31 "Why is this a required course?
54:33 "I hate this.
54:34 "Is there any way I can cheat "to just get a passing grade?" - Where's my shortcut?
54:38 - Exactly.
54:39 I mean, and you know, the difference today is that LLMs make it so much easier
54:44 and they really normalized cheating as well, where we don't have that good of systems in place
54:50 to be able to detect it for code, for writing, for anything.
54:55 And I think one of the problems here, you know, it goes back to like licensing or attribution.
55:01 When we normalize this kind of cheating, we're normalizing taking credit
55:05 for things that aren't our work.
55:07 And if we're doing that in school, we build those habits, what's it gonna look like
55:10 when we're working in the workforce?
55:12 We either don't have the skills that people think we have, or we think it's just normal, acceptable practice
55:18 to copy and paste and say, here's my intellectual contribution.
55:22 - It's too much of a crutch, and if maybe it solves 90% of the problems,
55:26 but that 10%, it doesn't, you're fully incapable of approaching that problem, right?
55:31 - Exactly, yeah.
55:32 And I think, so that's the first part, what LLM's offered us today.
55:35 I think the second part is say five to 10 years from now.
55:39 Part of it is scary and part of it is exciting.
55:41 I think that coding as it looks today is going to largely go away over my lifetime
55:48 because coding is this mix of art and intellectual labor and manual labor.
55:54 The manual labor parts will be going away and that's where a lot of people use LLMs now
55:59 to reduce some of that grind of coding.
56:02 And I think it's important for us to figure out where those intellectual contributions are,
56:07 where the art, the poetry of coding remains a human contribution moving forward,
56:13 where we have that sort of human in the loop to make ethical decisions that we don't pass off,
56:19 where it is humans who are doing some of the architecting and not just handing it off saying,
56:23 "Here's a prompt, now redesign our financial system from the ground up for us,"
56:27 but that it remains human guardrails and human ethics and human notions of justice that we use AI to help us,
56:37 but doesn't replace that.
56:38 - Yeah, I feel like there's gonna be a lot of people who are programmers now are gonna have to kind of be
56:43 a senior tech team lead type of thing, where the team is asking the LLM to do stuff for you.
56:50 And that's gonna be awesome for those people, us, but for the people who are brand new,
56:55 there's gonna be a wider gap to try to cross.
56:58 It's gonna be harder and harder to go from real beginner to that level when, who's going to employ you
57:04 when it takes you a day and I can ask the LLM to do it in five minutes and I got to review it either way.
57:09 That's a very concerning social consequence, I think.
57:13 - No, exactly.
57:13 I think those kind of entry-level jobs are very much more labor-focused, right?
57:20 The senior dev isn't doing that work because someone with less experience, less pay can do it.
57:27 And if LLMs replace that over time, It's really hard to get your foot in the door in that industry.
57:31 - Yeah, it can be like COBOL programmers did not a program without an LLM someday.
57:35 (laughing)
57:36 - Yeah.
57:37 (laughing)
57:38 - I don't know if that's good or bad, but it's gonna be weird.
57:40 Anyway, I think it's probably pretty interesting.
57:44 And given, you know, access with your API and with all this data, I'm sure people will be able to ask
57:49 and answer interesting questions with it.
57:51 - That's the hope.
57:52 - Indeed, all right.
57:53 Two really quick things to close out our conversation.
57:55 Roadmap, anything on the roadmap coming real soon that people have been asking about, thinking about?
58:01 - Yeah, so I just released V 2.0, I don't know, a month or so ago.
58:08 And so, thank you.
58:09 And that was really just a year of rethinking the API.
58:14 I was gonna allow myself breaking changes, really cleaning things up.
58:17 I added type annotations for the first time.
58:19 I really changed the linting and formatting, CI, pre-commit, everything.
58:24 So it's a much more rigorous package at this point.
58:28 I'm taking a breather right now, where I don't have that much big on the horizon.
58:34 I try to keep a really clean issue board as well, where I quickly triage, this is in scope, this is not.
58:40 - Yeah, I noticed you have three open issues and zero PRs, which is awesome.
58:43 - Yeah, I try to do it courteously, where I'll tell people a lot of the time,
58:47 you know, this isn't in scope for the project, but I appreciate the suggestion, but I'm busy,
58:51 so keeping a clean issue board makes my life simple.
58:53 So short answer, I'm taking a breather instead of road mapping in January.
58:59 - But you just had a big release, which is cool.
59:01 - Yeah.
59:01 - Yeah.
59:02 Contributions accepted?
59:04 - Absolutely.
59:04 And very often what I ask when someone opens an issue and I say, "Yeah, that does sound useful,
59:10 would you like to open a PR?" And as much as this is my side hustle, most of the pull requests that I add to it
59:19 are very much aligned with a current or recent research project that I'm working on.
59:24 So for others, if you see a gap or a cool feature that could make people's lives easier,
59:30 better analytics down the road, please propose it and I'd love a contribution.
59:34 - Excellent.
59:34 All right, final call to action.
59:35 People are psyched about mapping.
59:38 They wanna get started.
59:38 What do you tell 'em?
59:40 - I tell them to work through existing examples from the tools that are out there.
59:45 If you haven't done any kind of mapping before, there's a lot of cool packages in R and in Python.
59:51 Find something you're comfortable with.
59:53 work through some tutorials, and then figure out something close to home.
59:56 It's so much easier if you have that kind of local motivation, local knowledge.
01:00:01 Do some mapping, do an analysis in your community for something that's bothering you,
01:00:04 you know, you think could be better.
01:00:06 - Excellent.
01:00:07 All right, well, thank you for being here and congrats on that cool project.
01:00:10 - Thank you very much.
01:00:12 - This has been another episode of Talk Python To Me.
01:00:15 Thank you to our sponsors.
01:00:17 Be sure to check out what they're offering.
01:00:18 It really helps support the show.
01:00:20 This episode is sponsored by Posit Connect from the makers of Shiny.
01:00:25 Publish, share, and deploy all of your data projects that you're creating using Python.
01:00:29 Streamlit, Dash, Shiny, Bokeh, FastAPI, Flask, Quarto, Reports, Dashboards, and APIs.
01:00:36 Posit Connect supports all of them.
01:00:38 Try Posit Connect for free by going to talkpython.fm/posit.
01:00:42 P-O-S-I-T.
01:00:44 Want to level up your Python?
01:00:45 We have one of the largest catalogs of Python video courses over at Talk Python.
01:00:50 Our content ranges from true beginners to deeply advanced topics like memory and async.
01:00:55 And best of all, there's not a subscription in sight.
01:00:57 Check it out for yourself at training.talkpython.fm.
01:01:00 Be sure to subscribe to the show, open your favorite podcast app, and search for Python.
01:01:05 We should be right at the top.
01:01:06 You can also find the iTunes feed at /itunes, the Google Play feed at /play, and the Direct
01:01:12 RSS feed at /rss on talkpython.fm.
01:01:16 We're live streaming most of our recordings these days.
01:01:19 If you want to be part of the show and have your comments featured on the air, be sure
01:01:22 to subscribe to our YouTube channel at talkpython.fm/youtube.
01:01:27 This is your host Michael Kennedy.
01:01:29 Thanks so much for listening.
01:01:30 I really appreciate it.
01:01:31 Now get out there and write some Python code.